
 Faces Downward Pressure After $93 Resistance Rejection")
Key Takeaways
- SOL encountered strong resistance at $93, resulting in a 5.7% decline to approximately $87 within 24 hours
- The token trades beneath all major moving averages including the 20-, 50-, 100-, and 200-day EMAs
- Technical indicators including RSI and MACD reflect diminishing bullish momentum
- A developing bearish flag formation on daily charts suggests potential decline toward the $40–$45 price zone
- Despite price weakness, Solana’s network handled 44% of worldwide cryptocurrency transactions
Solana (SOL) faces mounting selling pressure following an unsuccessful attempt to breach the $93 resistance threshold. The cryptocurrency has since retreated and is now hovering around a critical support area that market participants are monitoring intensely.
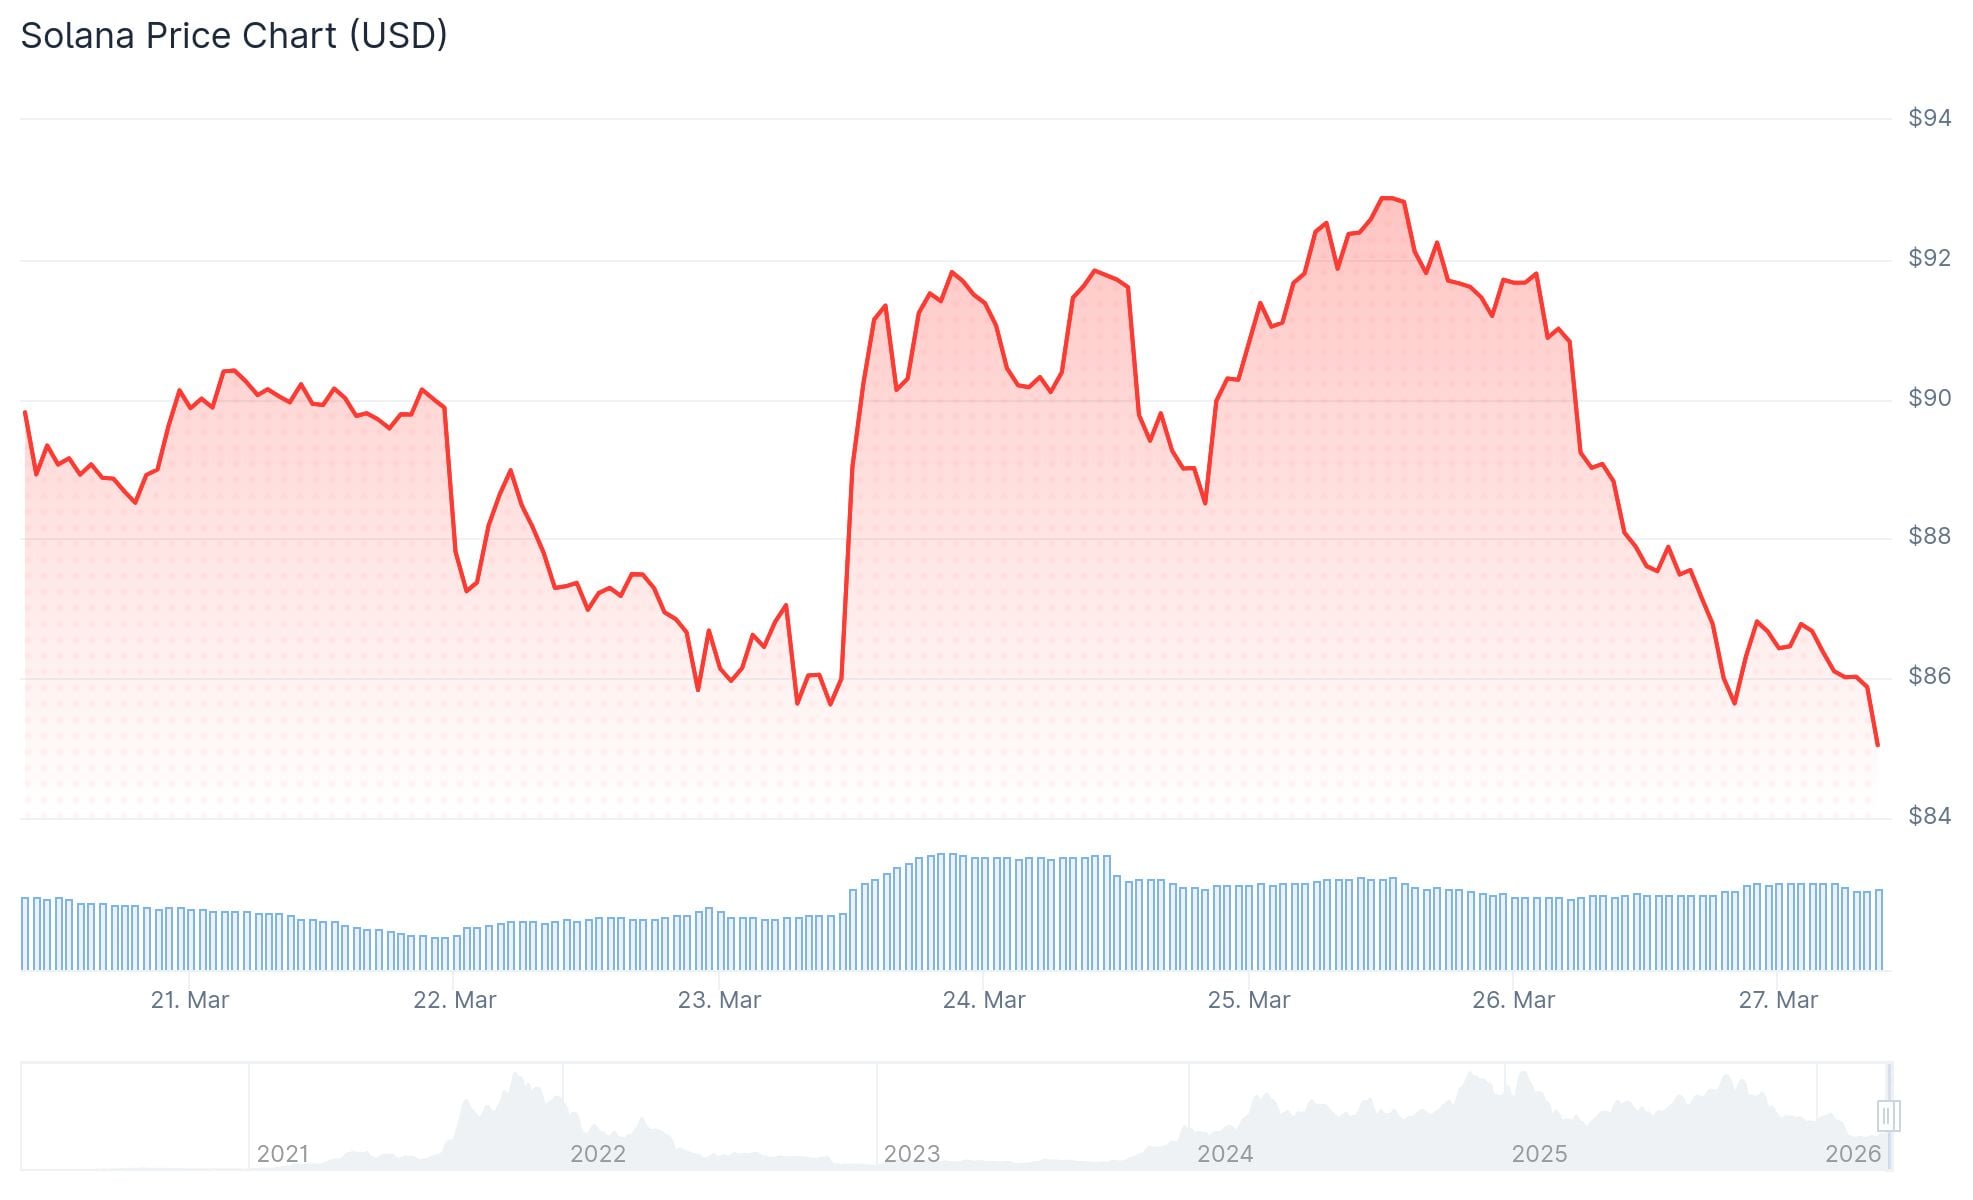
Currently, SOL is valued at $87.45. The 24-hour trading volume reached $5.62 billion, while its market capitalization stands at $50.21 billion. The asset has experienced a 5.70% decrease over the past 24 hours.
The $93 rejection was highlighted by cryptocurrency analyst BitGuru through a social media post on X dated March 26, 2026. The analyst noted that SOL has retreated to a historically significant support area following its inability to overcome resistance. The price action at this critical juncture may determine the token’s near-term trajectory.
Should demand materialize at these levels, SOL might stage a recovery attempt targeting upper resistance zones. Conversely, a breakdown below this support could trigger additional downside movement.
Technical Indicators Reflect Bearish Sentiment
Solana currently trades beneath every significant moving average. The 20-day EMA rests at $88.63, while the 50-day stands at $86.09. The 100-day moving average is positioned at $106.54, and the 200-day sits at $143.24.
Trading below both the 100-day and 200-day moving averages indicates the absence of sustained upward momentum.
The Relative Strength Index registers 47.66, positioned below its signal line at 52.54. The MACD indicator sits at 0.127, beneath its signal line of 0.232. The neutral MACD histogram suggests limited directional confidence among traders.
Bearish Flag Formation Threatens Further Decline
Technical analysis of the daily timeframe reveals a developing bearish flag pattern — a configuration resembling one observed earlier in the current year. During that previous occurrence, Solana experienced a significant downward breakout following pattern completion.
$SOL is repeating the same bearish flag pattern again.
Last time this setup formed → -54% crash. Now the same structure is playing out.
If this breaks down, $SOL could drop to $45–$40 within 1–2 weeks. Are you prepared for this move? pic.twitter.com/AH2XtnIQrJ
— Crypto Lens (@crypto_lens_) March 26, 2026
The present structure displays price consolidation within an ascending channel following a substantial decline. Should a breakdown materialize from these levels, technical projections estimate a potential move toward the $40 to $45 range within a one to two-week timeframe.
That’s a big one https://t.co/VsgRa5uZzF
— toly 🇺🇸 (@toly) March 26, 2026
Despite bearish price action, Solana’s blockchain demonstrates robust network activity. The platform processed 825,729,338 transactions from a total of 1,867,616,231 blockchain transactions during the measurement period — representing 44% of global cryptocurrency transaction volume.
Over 100 million Solana $SOL were transacted between $91.45 and $82.60, making this the most important demand zone.
Below it, key levels to watch are $53.10, $35.40, and $23.60. pic.twitter.com/RzeTZ6fQeb
— Ali Charts (@alicharts) March 26, 2026
Cryptocurrency analyst Ali Charts emphasized on X that more than 100 million SOL tokens changed hands between $91.45 and $82.60, designating this as the most critical demand area. Below this zone, significant support levels to monitor include $53.10, $35.40, and $23.60.