
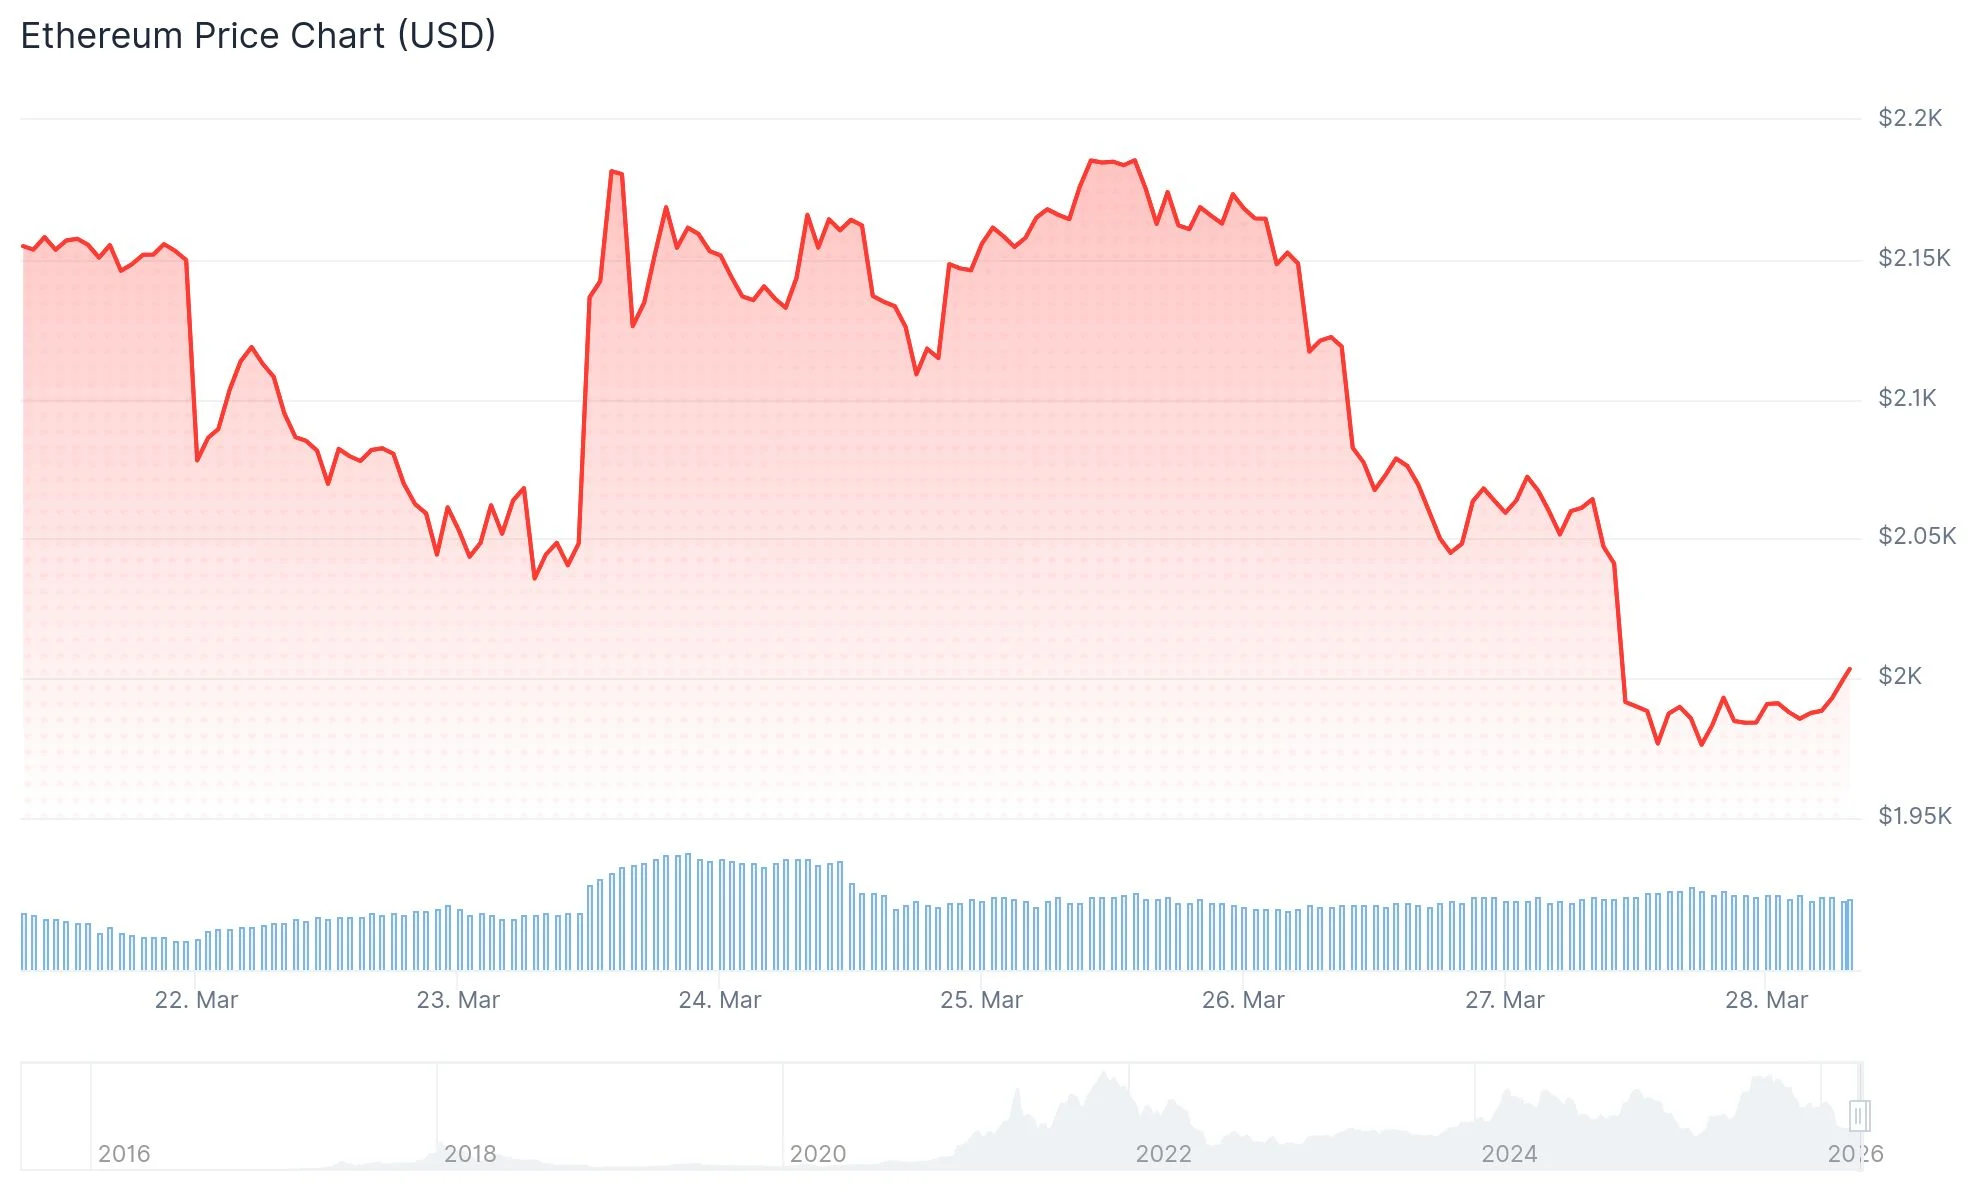
 Price Plunges Under $2,000 Amid $392M ETF Exodus")
Key Takeaways
- ETH breached the $2,000 psychological barrier with a 5% daily decline and 6% weekly loss
- Continuous institutional selling drove $392 million in net outflows from spot ETH ETFs across seven trading sessions
- Market demand metrics for ETH reached their weakest point in 16 months
- Critical technical support established at $1,911, with $1,750 emerging as the next significant downside target
- Ethereum holdings on centralized exchanges declined sharply from 22 million ETH in 2023 to approximately 15 million ETH currently
Ethereum breached the critical $2,000 threshold on Friday, March 27, 2026, triggering a massive wave of forced liquidations. Data from Coinglass revealed that long position holders suffered losses exceeding $111 million within a 24-hour window.
This downward movement amplified ETH’s weekly decline to 6%, simultaneously pushing the monthly performance figures into the red zone.
Global tensions contributed to the sell-off. Iran’s Islamic Revolutionary Guards Corps released statements warning personnel at industrial facilities across Israel and Gulf nations about potential retaliatory operations. These warnings came as a response to coordinated US-Israeli military actions targeting Iranian infrastructure, further intensifying risk-off sentiment across financial markets.
Institutional appetite for Ethereum exposure has evaporated rapidly. Spot Ethereum ETFs have witnessed an unbroken streak of seven consecutive trading days marked by net capital withdrawals, accumulating approximately $392 million in total outflows. The institutional support that previously underpinned price rallies has essentially vanished.
Market analyst Ted Pillows highlighted via X platform that daily ETH ETF outflows hit $92.5 million, with asset management giant BlackRock divesting $43.2 million worth of Ethereum holdings alone.
$ETH ETF outflow of $92,500,000 🔴 yesterday.
BlackRock sold $43,200,000 in Ethereum. pic.twitter.com/TO1s9byxEq
— Ted (@TedPillows) March 27, 2026
Retail investor enthusiasm has similarly diminished. The Coinbase Premium Index descended deeper into negative territory, signaling that US-based market participants are either actively liquidating positions or maintaining distance from new purchases.
Metrics compiled by Capriole Investments indicate that apparent purchasing demand for ETH has remained in negative territory throughout March, currently registering the lowest reading observed in 16 months.
Chart Analysis Signals Further Downside Risk
Examining the daily timeframe, ETH is currently trading beneath its 20-day exponential moving average. The 50-day and 100-day EMAs are positioned considerably higher at $2,180 and $2,430 respectively, confirming that the dominant trend remains bearish.
ETH Daily Technical Outlook:$ETH closed bearish as it’s simply mirroring Bitcoin's overall sentiment. We should see further downward pressure, although a short-term bullish pullback and then a bearish move will result in a short opportunity 🤔 pic.twitter.com/cpajMsx1rs
— CRYPTOWZRD (@cryptoWZRD_) March 28, 2026
Technical analyst CryptoWZRD highlighted that the weekly candle close below $2,200 served as an initial cautionary signal preceding “additional downward movement.” Following the successive breaks of $2,100 and $2,000 support levels, the subsequent critical zone spans $1,750–$1,850.
Market commentator CyrilXBT published chart analysis demonstrating ETH positioning well beneath its 200-day EMA located near $2,766. His analysis cautioned that a decisive break below the $1,750 support floor could accelerate price movement toward the $1,400–$1,500 range.
ETH – $2,064
Similar story to BTC but weaker.
– Crashed from $4,000+ to $1,750 lows – massive downtrend since October.
– EMA 200 is way overhead at $2,766, acting as a ceiling.
– The pink box around $2,200–$2,400 was a supply zone – price got rejected there and is now fading… pic.twitter.com/wv4UKq0DaR— CyrilXBT (@cyrilXBT) March 27, 2026
On-Chain Metrics Present Mixed Signals
Countering the bearish price action is exchange reserve data. CryptoQuant analytics shared by researcher James Easton indicate that Ethereum balances on centralized exchanges have contracted dramatically from over 22 million tokens in 2023 to approximately 15 million ETH presently. Easton characterized large holders as actively “stacking and staking.”
Nevertheless, declining exchange inventories in isolation do not guarantee imminent price reversal. While the metrics demonstrate tokens migrating off trading platforms, they cannot definitively confirm accumulation by bullish investors.
Regarding institutional accumulation activity, BitMine Immersion wallet addresses acquired 117,111 ETH across a three-day period, according to Lookonchain monitoring. This entity had previously verified an acquisition of 65,341 ETH.
ETH futures open interest climbed to 14.72 million ETH, despite funding rates rotating into negative territory.
The immediate support level is positioned at $1,911, with secondary support established at $1,741. A confirmed break beneath $1,741 would validate continuation of the prevailing bearish trend structure.