
 Price Under Pressure as Treasury Yields Approach 5% and Oil Soars Past $106")
Key Takeaways
- Bitcoin hovers around $66,126, potentially closing March as its sixth consecutive negative month.
- U.S. 10-year Treasury yields are edging closer to the 5% threshold, a level that has historically correlated with BTC price declines.
- Spot Bitcoin ETFs experienced $296 million in net outflows last week, ending a four-week streak of positive flows.
- Brent crude oil has rallied from approximately $75 to roughly $106 throughout March, intensifying inflation worries.
- BTC remains trapped in a trading range between $65,000 and $72,000 as investors remain cautious about taking directional positions.
Bitcoin faces mounting headwinds as multiple macro factors converge to pressure the leading cryptocurrency. With U.S. Treasury yields climbing, crude oil prices surging, and institutional money reversing course through ETF outflows, BTC was hovering near $66,126 at the time of writing, poised for another bearish monthly candle.
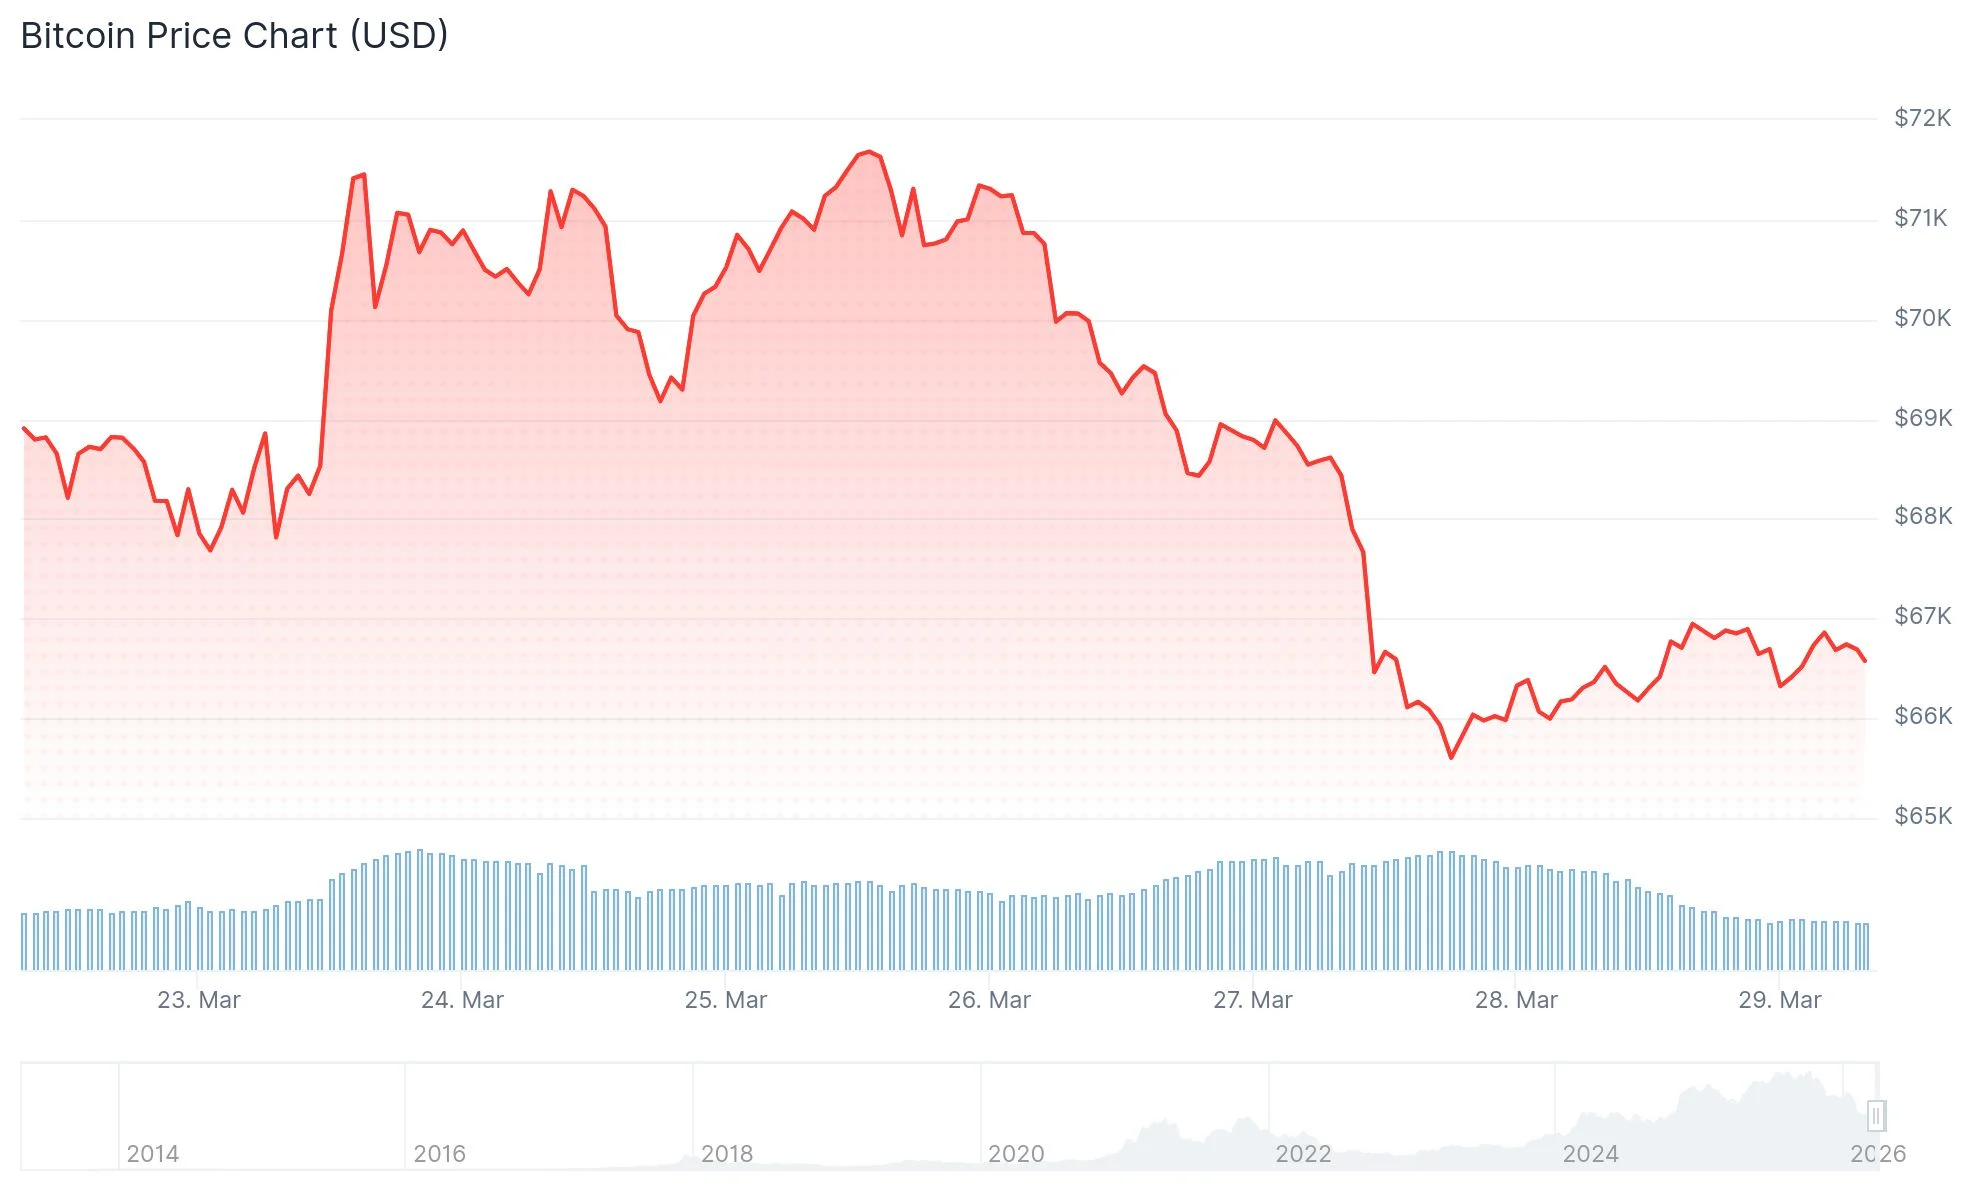
The month began with promise as Bitcoin surged to $76,000 in early March, driven partly by positive sentiment surrounding potential diplomatic breakthroughs involving the United States, Iran, and Gulf region nations. However, broader macroeconomic forces have since reversed that optimism.
Traders are now laser-focused on the U.S. 10-year Treasury yield, which appears to be forming a bullish flag continuation pattern on technical charts. This formation typically precedes additional upward movement. Should this pattern confirm with a breakout, yields could advance toward or beyond the 5% threshold, a level not witnessed since 2023.
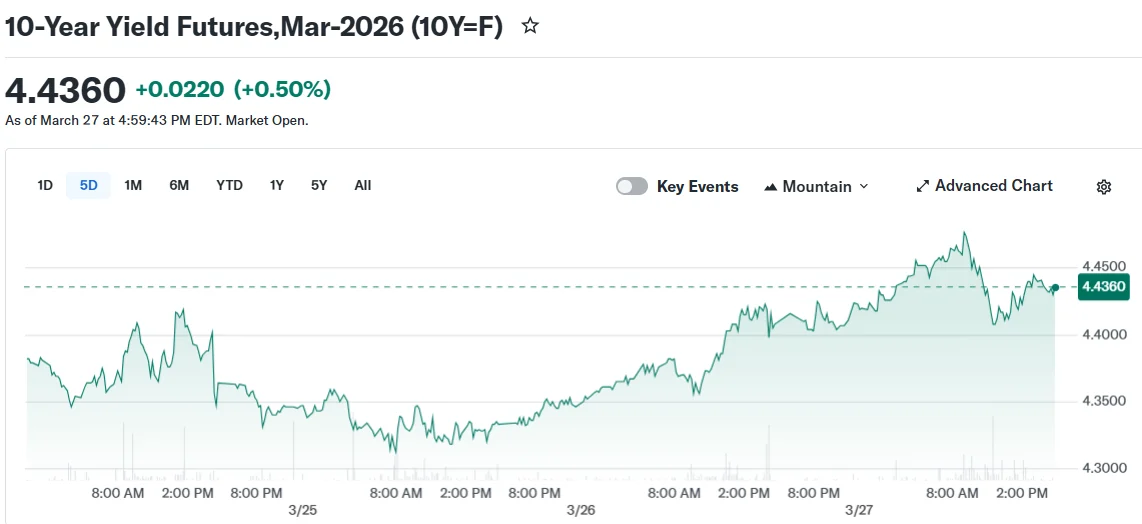
Elevated bond yields enhance the appeal of traditional fixed-income investments, redirecting capital flows away from speculative assets such as Bitcoin. Historical precedent supports this inverse relationship. During the period spanning October 2021 through December 2022, Treasury yields climbed from 1.45% to 3.90%, coinciding with Bitcoin’s collapse from $67,000 down to $16,256.
Market analysts warn that if yields breach the 5% level, Bitcoin could retreat to a critical demand zone spanning $58,632 to $55,302.
Institutional Money Retreats as ETF Flows Turn Negative
The spot Bitcoin ETF market experienced a notable reversal last week, recording net outflows totaling $296.18 million. This marked the first weekly withdrawal after four consecutive weeks that brought in more than $2.2 billion cumulatively.
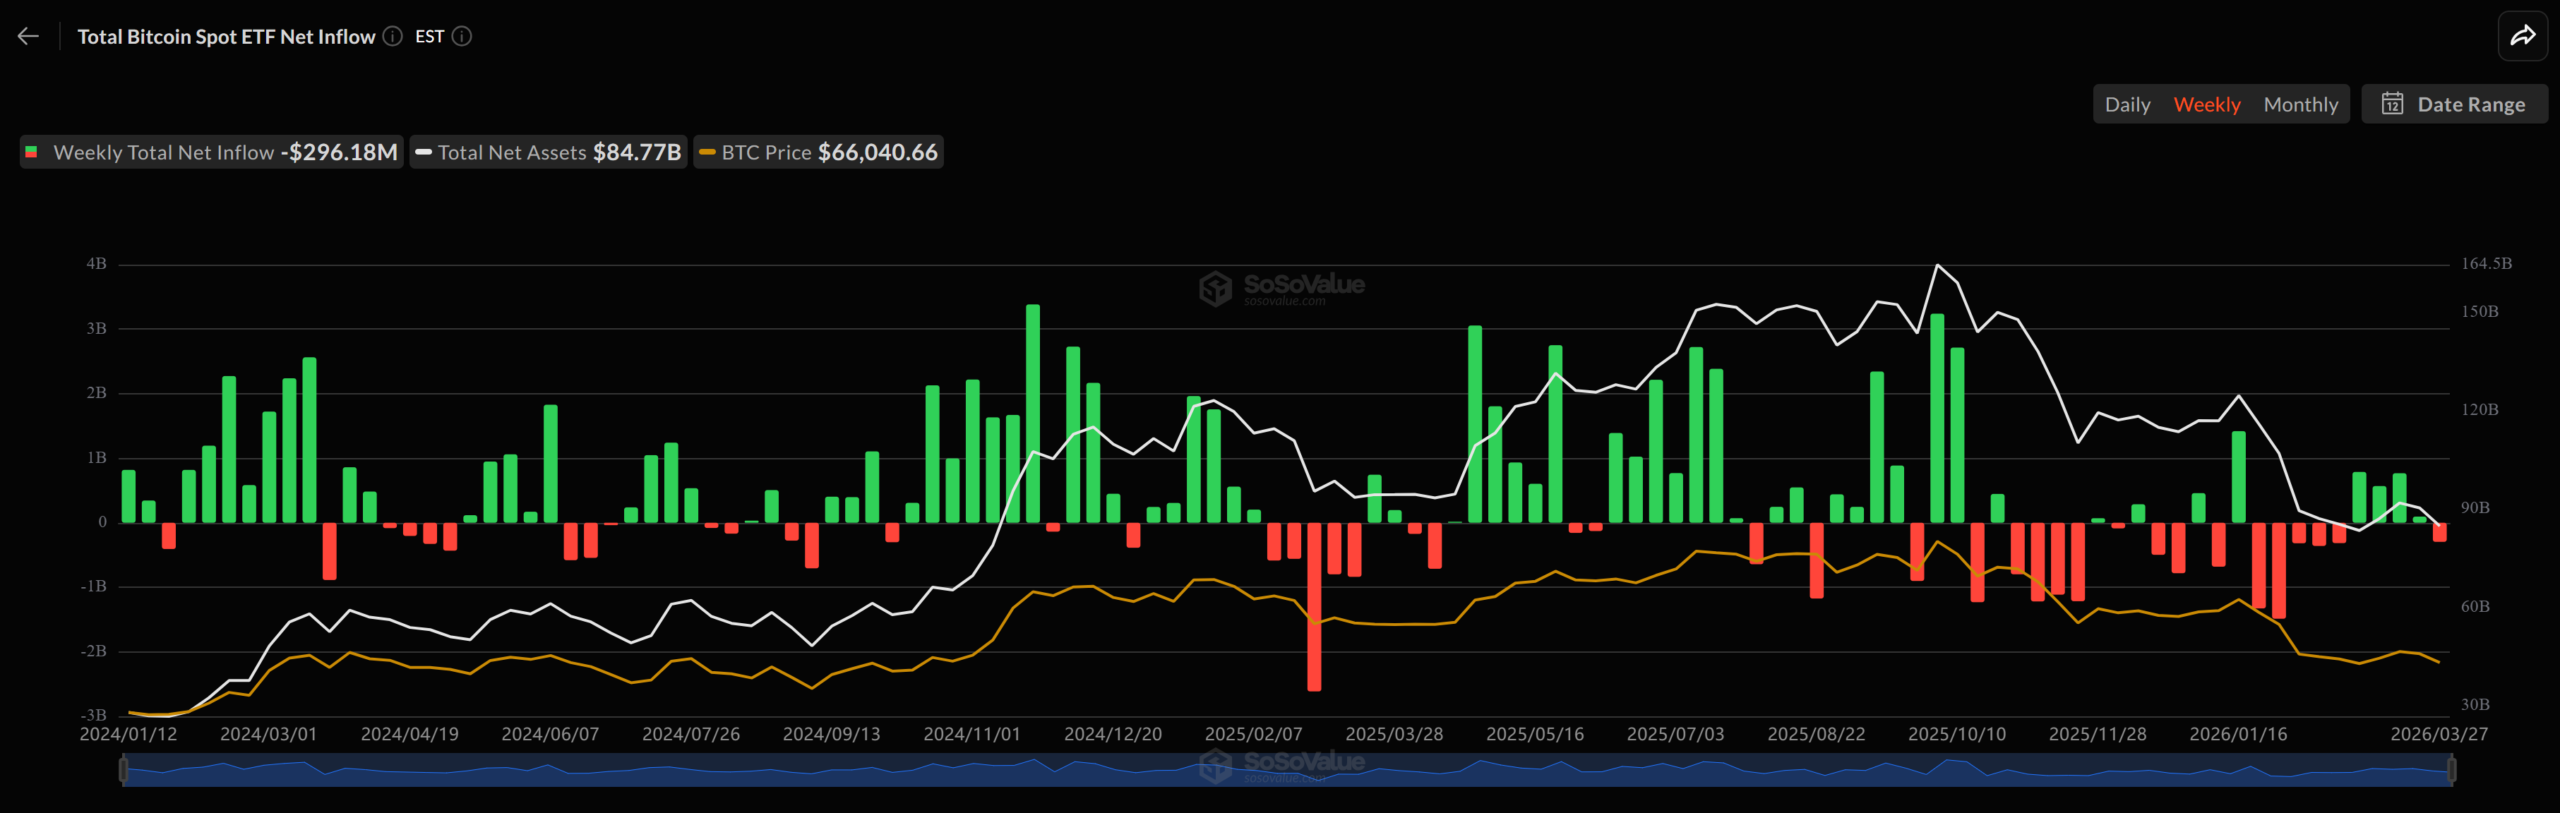
The final two trading days of the week proved particularly challenging, with combined withdrawals exceeding $396 million. Friday’s single-session outflow of $225.48 million represented the largest daily exodus since March 3.
Aggregate net assets held within spot Bitcoin ETF products declined to $84.77 billion from over $90 billion just one week prior. Meanwhile, weekly trading activity dropped substantially to $14.26 billion, a sharp decrease from the $25.87 billion recorded earlier in March.
According to a Bitunix market analyst, the current environment exhibits “surface stability, internal imbalance.” The analyst observed that Bitcoin is functioning less as a momentum-driven asset and more as a barometer of liquidity conditions. “Capital remains in the system, but market participants are refusing to commit to directional bets,” the analyst explained.
Energy Price Surge Complicates Inflation Outlook
Crude oil markets have experienced dramatic appreciation throughout March. Brent crude has rocketed from approximately $75 per barrel at month’s start to around $106 currently. West Texas Intermediate (WTI) crude was trading near $101 at press time.
This sharp price increase stems from supply constraints and heightened geopolitical tensions, particularly concerns surrounding potential disruptions in the strategically vital Strait of Hormuz. Rising energy costs diminish expectations for imminent central bank interest rate reductions, maintaining restrictive financial conditions that challenge risk assets.
Spot Ethereum ETFs similarly experienced their second consecutive week of withdrawals, posting $206.58 million in net outflows.
Get ready for a crazy move in Bitcoin.
If BTC closes March in the red, this will be the 6th consecutive red monthly close.
This has only happened once in Bitcoin's history, in the year 2018.
But the crazy part is that the last time this happened, BTC pumped 317% from $3,349 to… pic.twitter.com/5N7VEVn6Lw
— Ash Crypto (@AshCrypto) March 29, 2026
Cryptocurrency analyst Ash Crypto highlighted on X that should Bitcoin finish March negatively, it would represent the sixth consecutive red monthly close—a streak matched only once previously in Bitcoin’s history, occurring in 2018.
Despite recent outflows, cumulative net inflows into spot Bitcoin ETF products remain substantial at $55.93 billion according to the most recent available data.