
 Price Faces Pressure as ETF Outflows Surge and Analysts Flag $45–$75 Entry Zone")
Key Takeaways
- Solana climbed more than 2% on Monday following a four-day losing streak that resulted in a cumulative 5% decline last week.
- Spot Solana ETFs in the United States saw $7.84 million exit on Friday, marking the fourth-highest single-day withdrawal since launch.
- Derivative traders faced $22.98 million in liquidations over 24 hours, with long positions representing $19.18 million of the total.
- Funding rates have shifted negative to -0.0141%, indicating traders are compensating others to maintain short exposure.
- Critical support is identified around the $70–$75 range, with technical analysts monitoring for a potential decline toward $50 if this floor gives way.
Solana is attempting a rebound following a challenging week, yet underlying market data paints a more cautious picture. Substantial ETF withdrawals, significant liquidation events, and bearish derivative metrics suggest the current recovery may lack staying power.
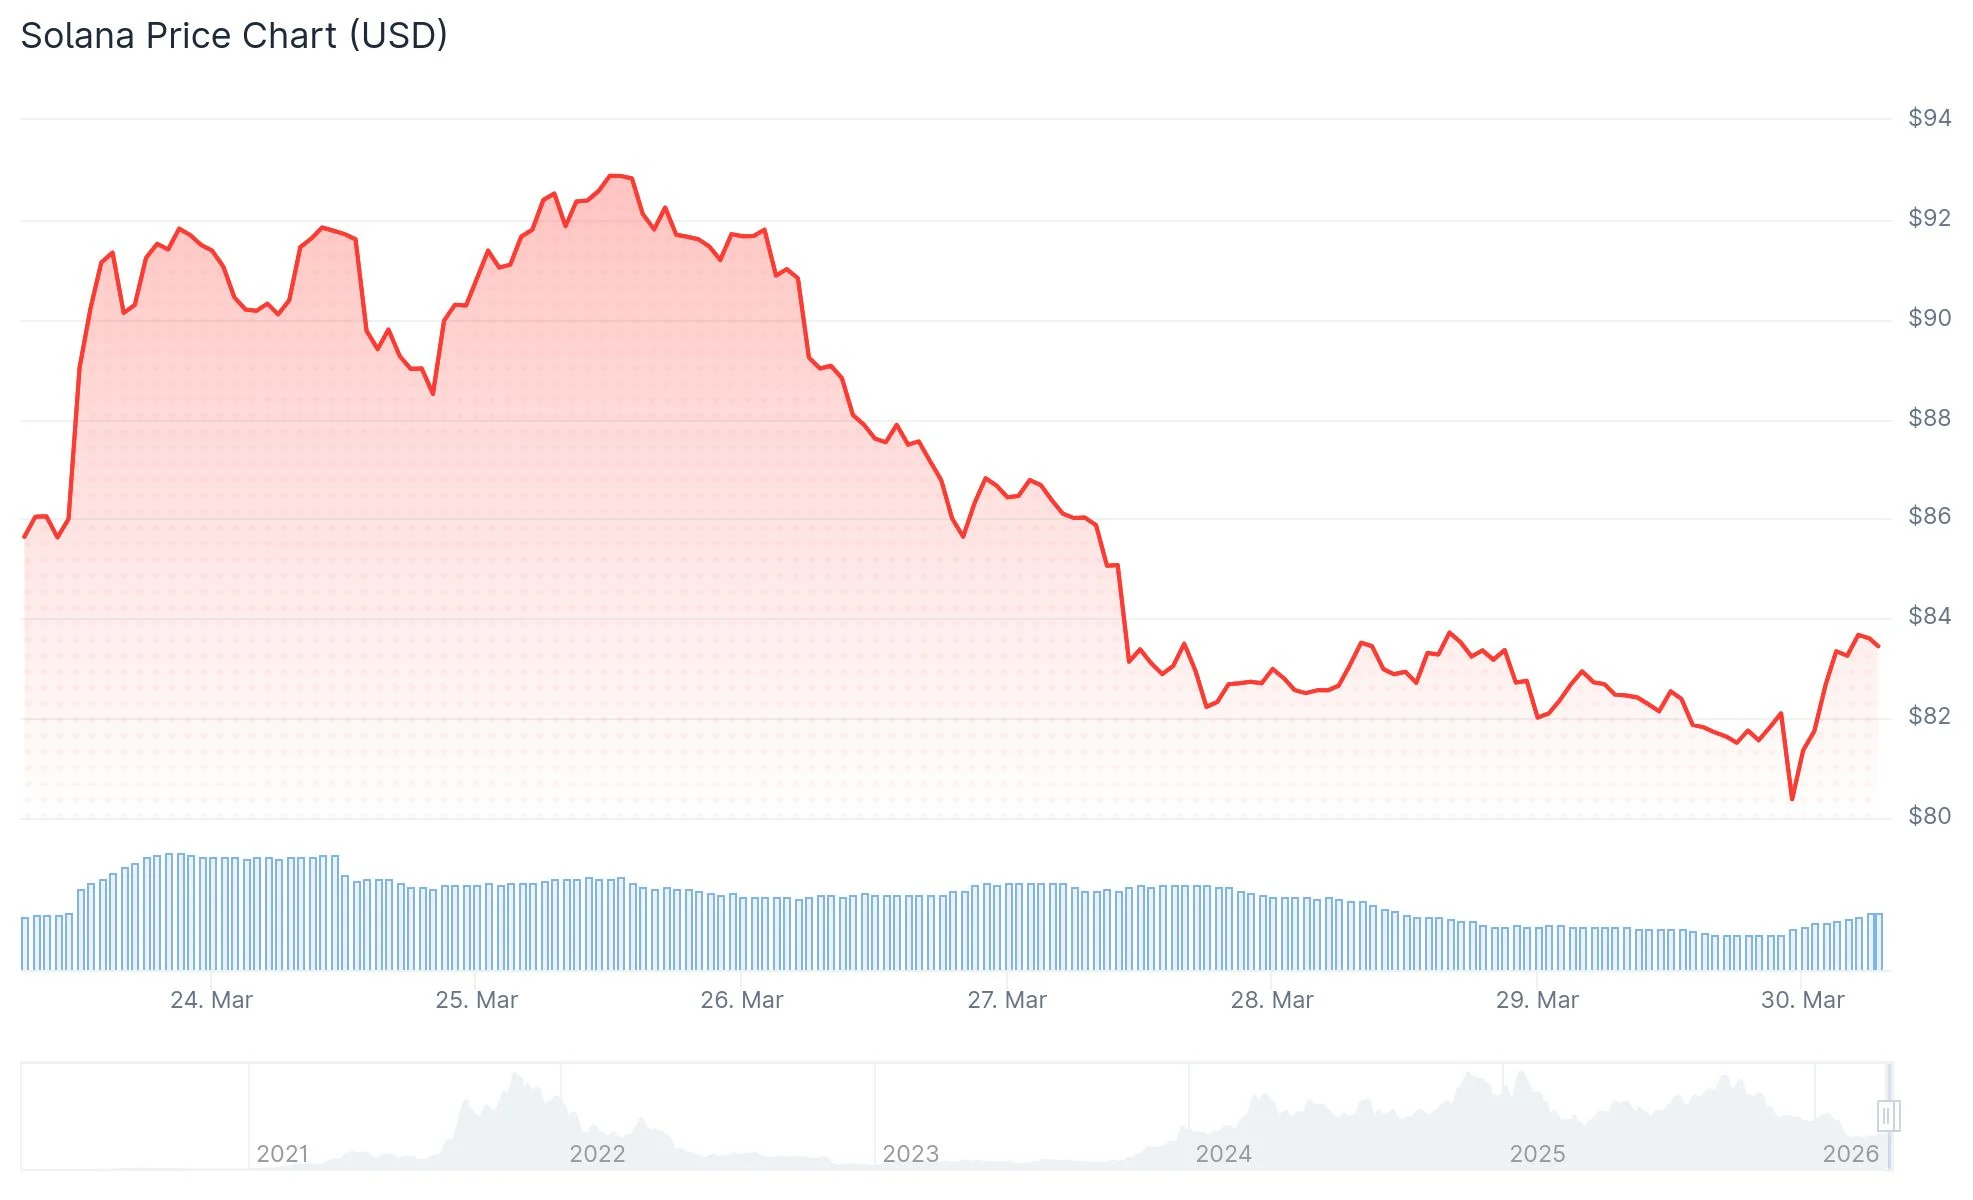
Solana concluded the previous week with approximately a 5% decline, dipping to lows just above the $81 threshold before posting a 2% gain on Monday. The asset breached a rising support trendline near $88, a development many chart watchers interpreted as a significant shift in momentum.
All three major Exponential Moving Averages—the 50-day, 100-day, and 200-day—are currently positioned above the spot price, reinforcing the bearish technical backdrop. For sentiment to pivot, SOL would need to secure daily closes above $91.
The MACD histogram has dipped beneath its signal line and entered negative territory. Meanwhile, the RSI reading of 42 remains below the neutral 50 threshold, indicating selling pressure continues to dominate.
U.S. spot Solana exchange-traded funds experienced $7.84 million in net withdrawals on Friday exclusively. This represented the fourth-largest single-session outflow since these investment vehicles debuted, and extended a streak of negative net flows to three consecutive weeks.

Should institutional capital continue exiting throughout the current week, it would intensify downward pressure on an already vulnerable price structure.
Within the derivatives market, $22.98 million worth of SOL contracts were liquidated during the last 24-hour period. Long positions accounted for the overwhelming majority at $19.18 million.
The negative funding rate of -0.0141% reveals that traders are accepting costs to maintain short exposure, a clear reflection of prevailing bearish sentiment in the market.
Analysts Highlight $70–$75 as Critical Support Territory
Crypto analyst Patel shared a two-week timeframe chart illustrating that SOL has declined approximately 77% from its peak near $250. His technical analysis identifies a crucial support and potential entry zone spanning $45 to $75, with a Fibonacci retracement level at $52.11 representing a deeper downside target.
Where Are All The Solana Maxis Now? 🤔
They Told Their Followers To Buy $SOL Above $250. Screamed "To The Moon" At ATH.
Now Price Is Below $80… And They're Silent. Not A Single Tweet Saying "Buy Now."
Funny How That Works Right?
Bullish At $250. Silent At $80. That Tells You… pic.twitter.com/SRiCYSIr5N— Crypto Patel (@CryptoPatel) March 28, 2026
Patel observed that bullish enthusiasm was widespread when Solana traded above $250, yet has grown notably quiet with prices now below $80. He interprets the current weakness as a possible accumulation opportunity for long-term investors, projecting eventual targets of $500 and $1,000 over an extended timeframe.
A complementary assessment from More Crypto Online utilized an hourly chart to demonstrate that Solana had violated a near-term ascending trendline. This analyst characterized the movement as a potential “wave 3” decline, identifying a support band between $71.91 and $77.91.
Current Technical Picture
Near-term support rests at the recent floor of $81.44. A breakdown below this level would expose the $75.63 mark, which represents the February 24 low that initiated the previous uptrend.
Overhead resistance is concentrated between $84.85 and $87.71, with the 50-day EMA at $91.24 presenting a more substantial barrier to upward movement.
SOL ETF activity remains under close scrutiny, with Friday’s $7.84 million withdrawal providing the most concrete evidence yet of institutional caution.