
 Price Alert: Three Technical Analysts Converge on Critical Support Zone")
Key Takeaways
- Ethereum is currently hovering around $2,000 after retreating from recent peaks, with sellers maintaining dominance.
- Multiple technical analysts identify similar resistance levels and project downside moves to $1,900 or below.
- A four-hour timeframe analysis suggests a potential decline to $1,387 if support at $1,755 fails.
- Daily trading volume surged 150% to approximately $19 billion as market participants battle over the $2,000 threshold.
- On-chain MVRV analysis indicates a possible cycle bottom could materialize near the $1,800 region.
Ethereum finds itself caught in a converging web of bearish signals. Technical charts, blockchain metrics, and broader economic factors are creating a challenging environment for the second-largest cryptocurrency.
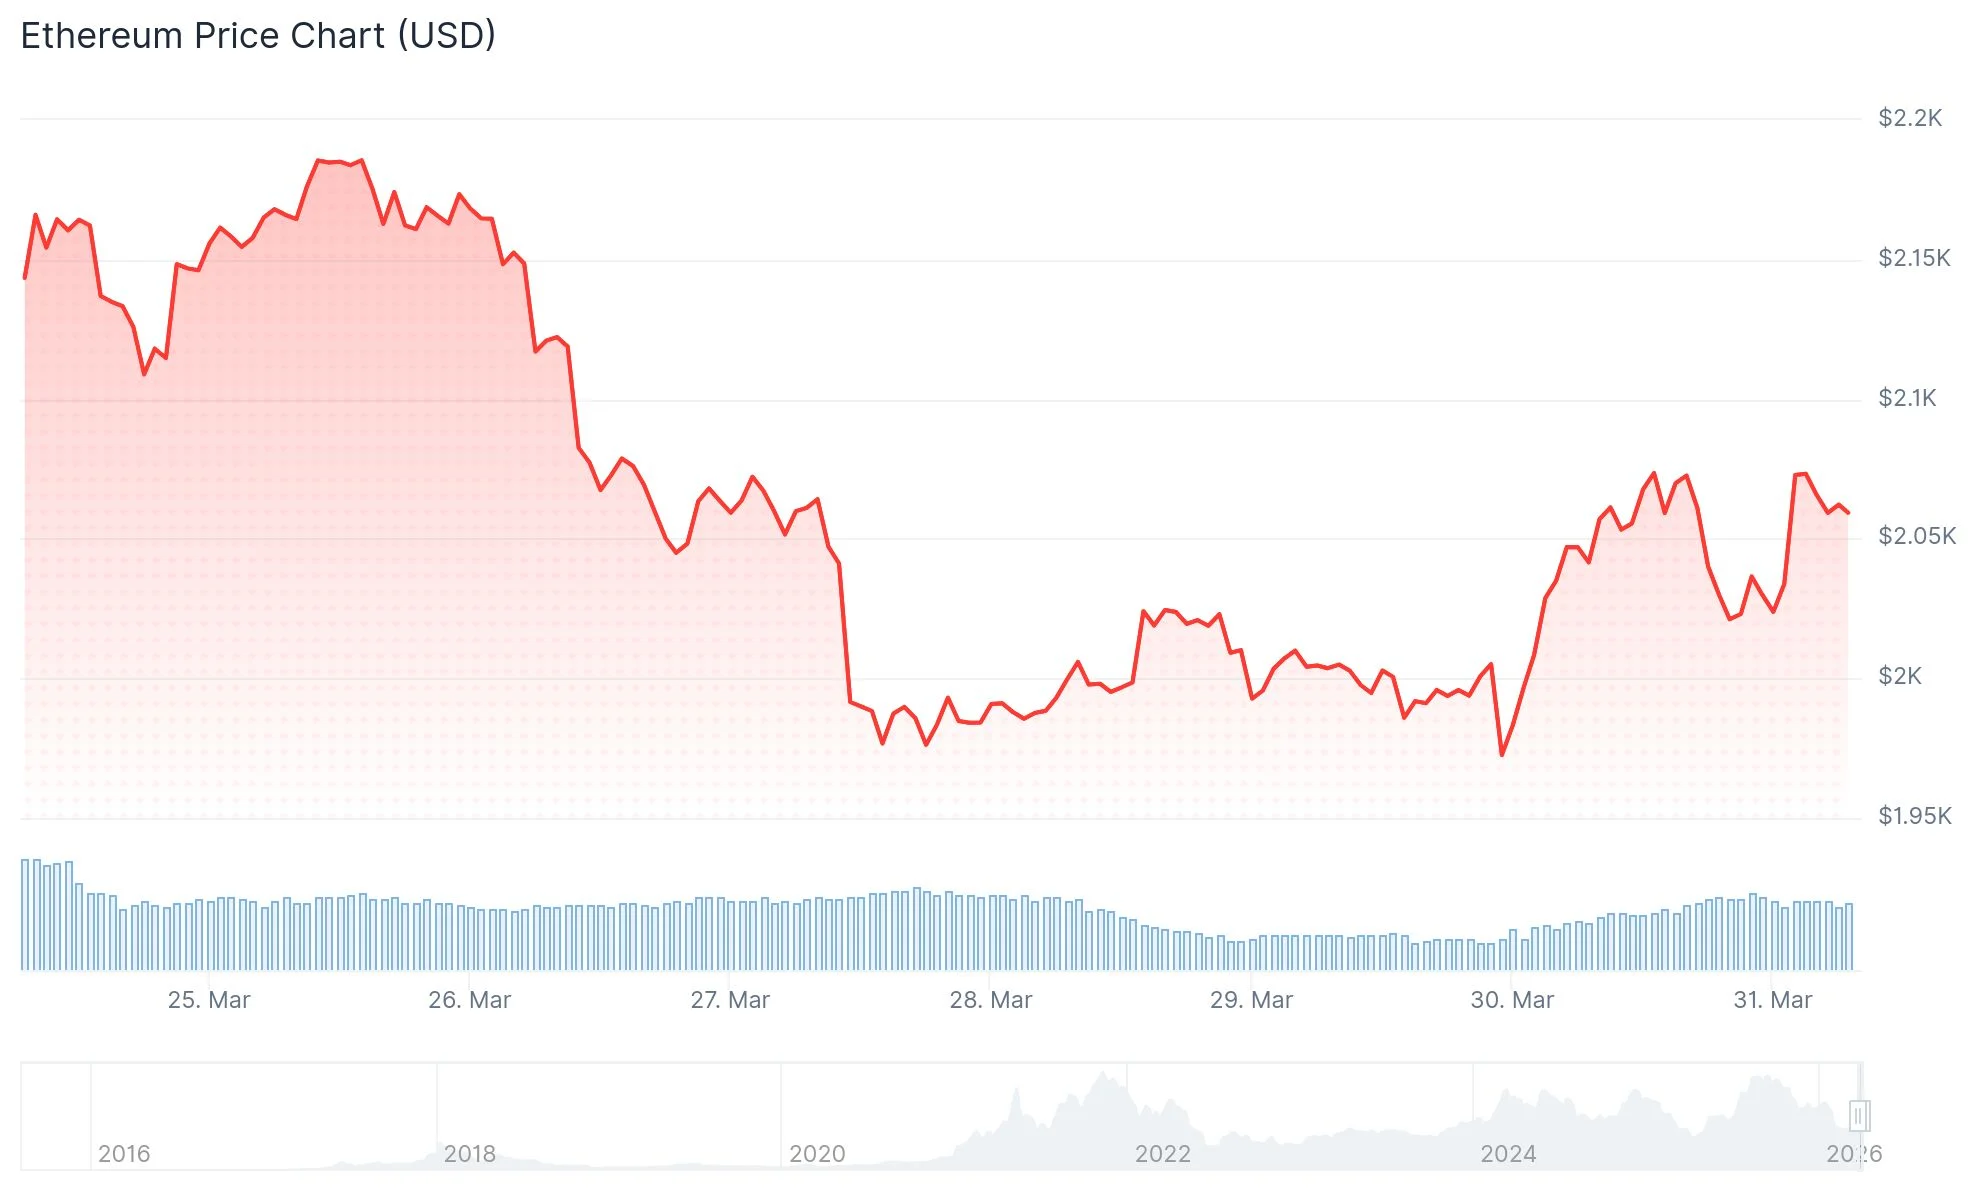
The digital asset is clinging to support just north of the psychologically significant $2,000 mark. Earlier on Sunday, ETH briefly slipped beneath this threshold before demand emerged. However, the subsequent rebound has lacked conviction. After touching an intraday peak of $2,085, price action retreated to approximately $2,036, with market observers suggesting sellers maintain control.
A dramatic 150% increase in 24-hour trading activity pushed volumes near the $19 billion threshold. This represents roughly 9% of Ethereum’s circulating valuation. While elevated volume during a recovery attempt can indicate genuine accumulation, the price response thus far suggests insufficient buying pressure to reverse the prevailing trend.
Broader economic developments are compounding the challenge. Crude oil has climbed back above $100 per barrel amid escalating tensions involving Iran. This development creates headwinds for risk-oriented assets across markets, with cryptocurrency particularly vulnerable. Additionally, higher energy costs increase the probability that the Federal Reserve maintains its restrictive monetary stance longer than previously anticipated, further dampening appetite for speculative positions.
Technical Picture Reveals Convergence
Analyst Elja presented a 12-hour chart highlighting a recurring behavioral pattern. While Ethereum has managed multiple bounce attempts, each recovery has failed to breach the dominant downtrend structure. His technical roadmap anticipates a move toward the $2,200–$2,300 zone where resistance would likely emerge, followed by rejection and a subsequent decline back through $2,000 toward $1,900.
[[SCRIPT_0]]
Meanwhile, analyst Man of Bitcoin shared a four-hour timeframe perspective with more pronounced bearish implications. His framework identifies a well-defined descending resistance line capping upside attempts. Should ETH lose the $1,755 support zone, his analysis projects a trajectory toward $1,387. Elliott Wave structure notation on his chart indicates the market remains within a corrective phase rather than establishing a meaningful reversal.
On the social platform X, analyst Ted Pillows highlighted that Ethereum has violated its RSI uptrend, cautioning: “Price will be next.” The Relative Strength Index has already crossed below its 14-period moving average. It momentarily touched below the 40 threshold, a technical level that typically confirms seller dominance.
[[SCRIPT_1]]
Blockchain Metrics Point to $1,800 Support Zone
One particular on-chain indicator is capturing significant attention: the 365-day Market Value to Realized Value (MVRV) Ratio. When this metric falls into negative territory, it signals that a majority of holders are underwater on their positions. A comparable configuration emerged in April 2025, immediately preceding a substantial rally in ETH.
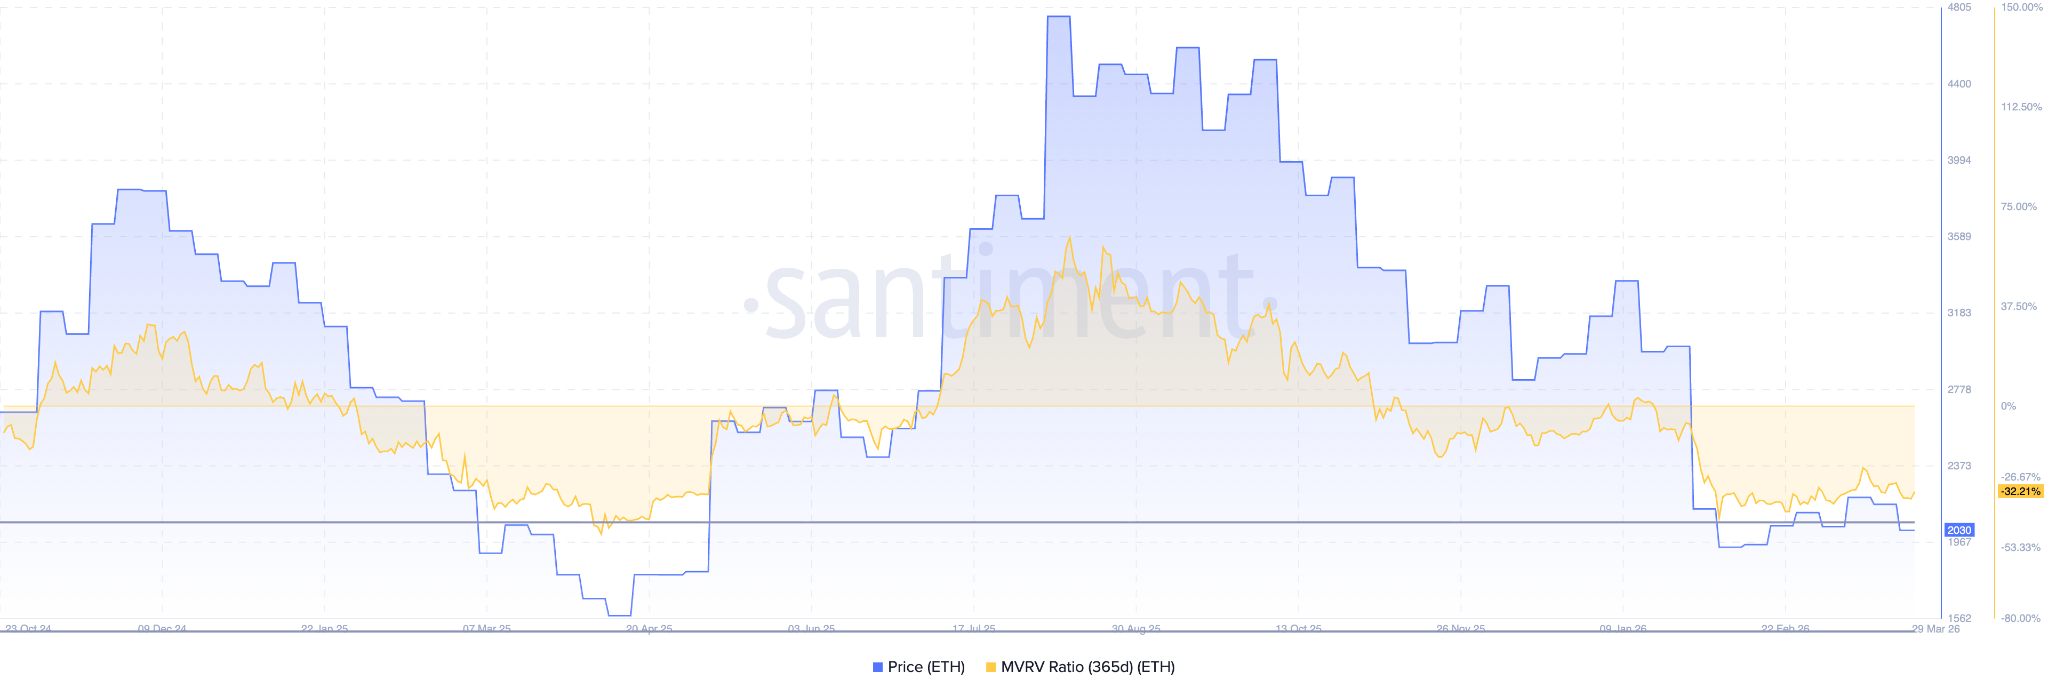
Based on current metric readings, several analysts identify $1,800 as the most probable support floor for this market cycle. While a temporary bounce toward $2,150 remains within the realm of possibility, the overarching technical framework continues to favor additional downside. The only development that would materially alter the bearish bias would be a decisive breakout and sustained trading above $2,150, potentially triggering liquidations of short positions.
As of this analysis, Ethereum remains precariously positioned above the $2,000 level with sellers maintaining the advantage and the next critical support zone established at $1,800.