
 Reclaims Momentum as Bulls Secure $2,000 Support Level")
Quick Overview
- ETH maintained its position above the $2,000 threshold with derivatives indicators showing increased buyer momentum.
- Positive net taker volume persists from March 6 onward, demonstrating heightened buyer engagement.
- Open interest in futures contracts expanded to 6.4 million ETH, nearing 2024’s highest levels.
- Spot Ethereum ETFs recorded $120 million in net positive flows, marking the strongest single-day performance since mid-March.
- Market experts emphasize the importance of maintaining $2,000, with secondary support identified between $1,750 and $1,800.
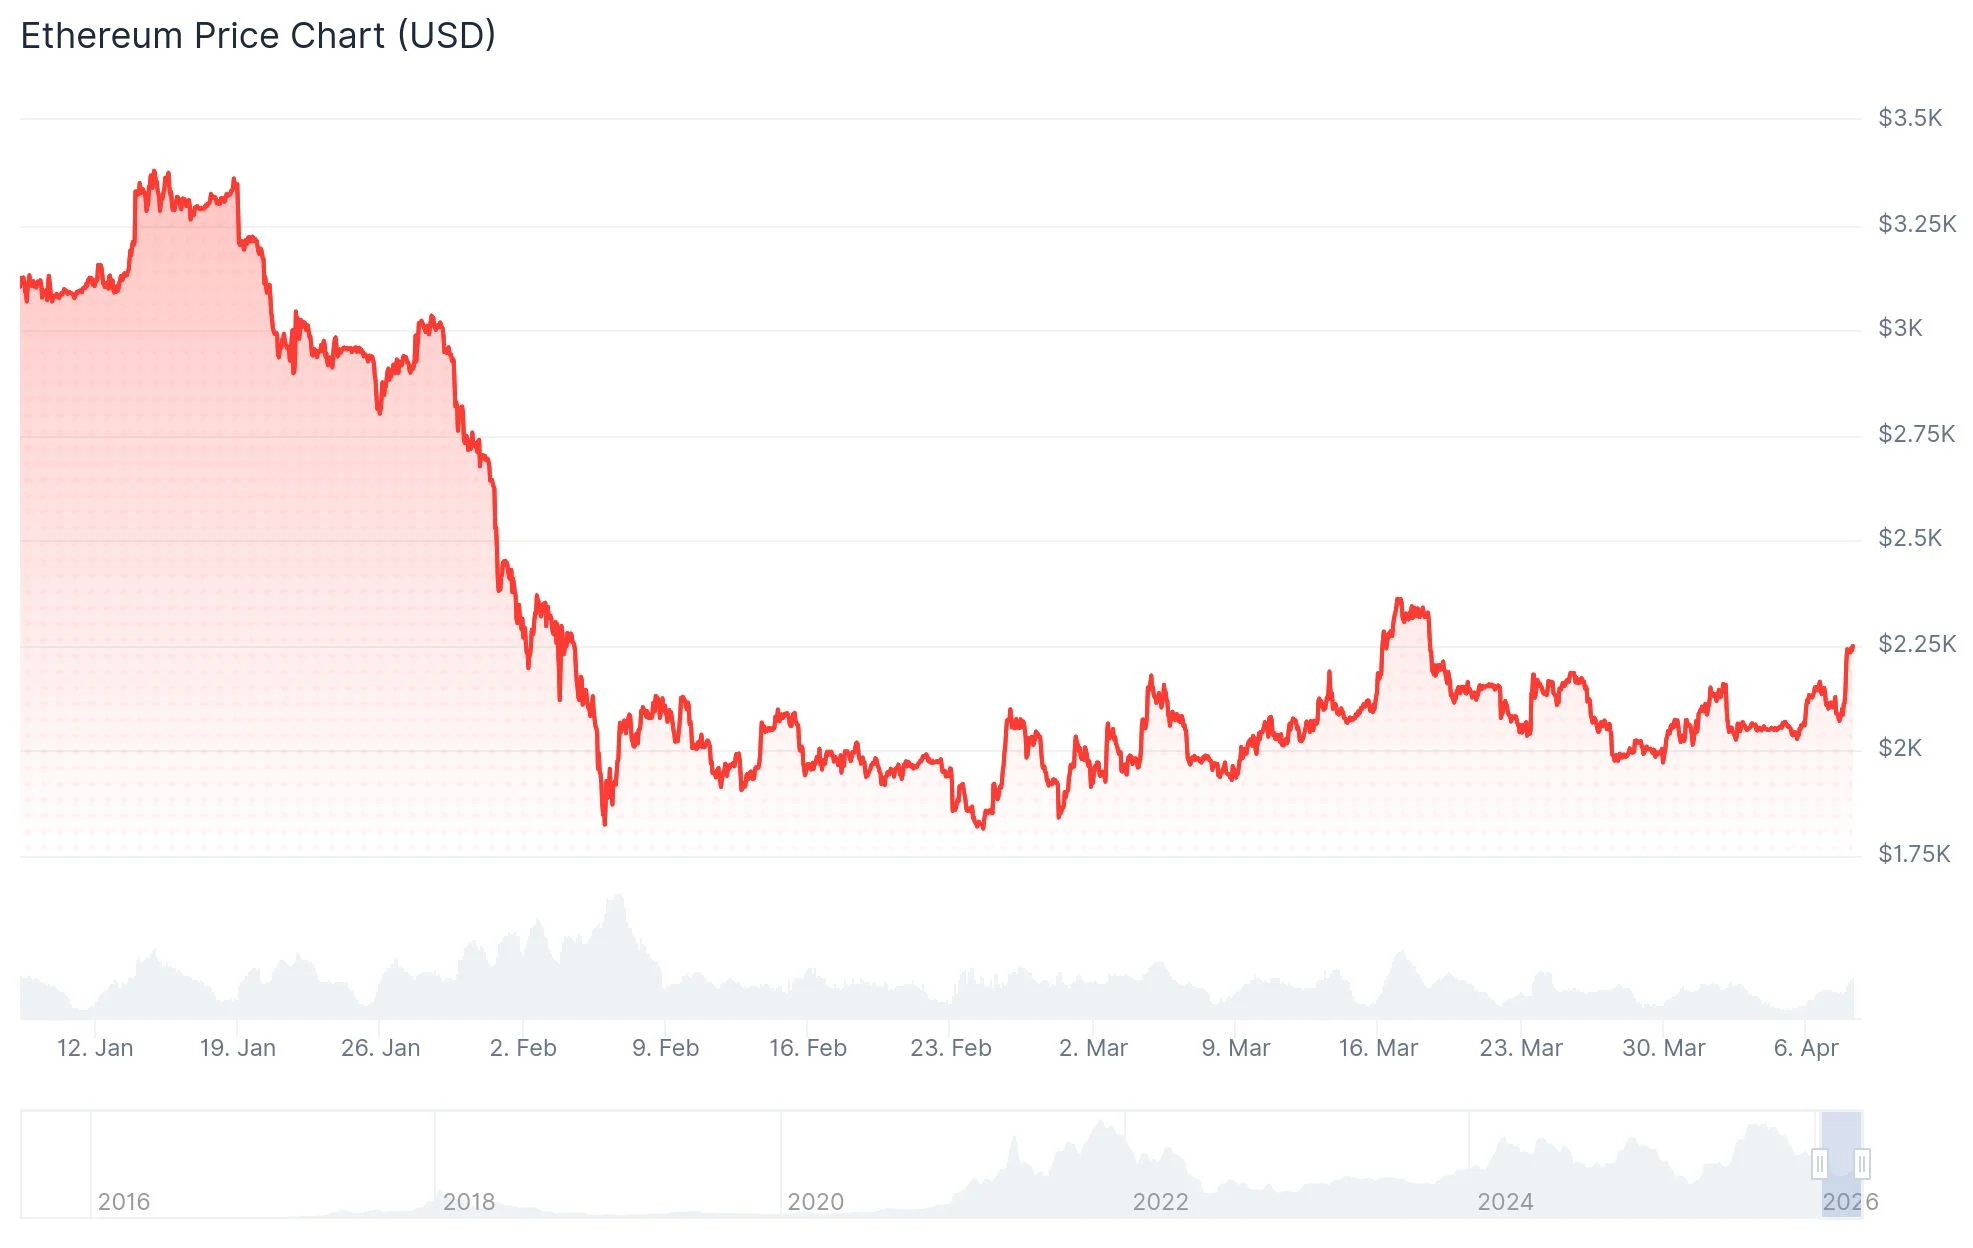
Ethereum (ETH) was changing hands near $2,249 following a bullish advance that saw buyers successfully protect the critical $2,000 support zone. Emerging market indicators point toward strengthening demand dynamics.
Market observers monitoring derivatives markets report that purchasing activity is currently dominating. This transformation has sparked discussion about a potential trend reversal.
The net taker volume indicator has registered positive readings consistently since March 6. This measurement reveals whether aggressive purchasing or selling forces are dominating derivatives markets.
Darkfost, a market analyst, noted that buying momentum continues with net taker volume reaching $104 million. He highlighted this as the first sustained shift of this nature in Ethereum derivatives markets since the previous bear cycle.
🟢This is the first time since the previous bear market that we are witnessing such a regime shift in Ethereum derivatives.
While it has remained negative most of the time since 2023, the Net Taker Volume on ETH is now positive.
–💡Net Taker Volume is an indicator used to… pic.twitter.com/GDQptgd2yu
— Darkfost (@Darkfost_Coc) April 4, 2026
Futures Activity and ETF Momentum Indicate Growing Interest
The analyst noted this configuration may support upward price movement if sustained alongside strengthening spot market demand. Growing futures participation reinforces this perspective.
Open interest in Ethereum futures expanded to 6.4 million ETH. This figure approaches the record level of 7.8 million ETH established in July 2025.
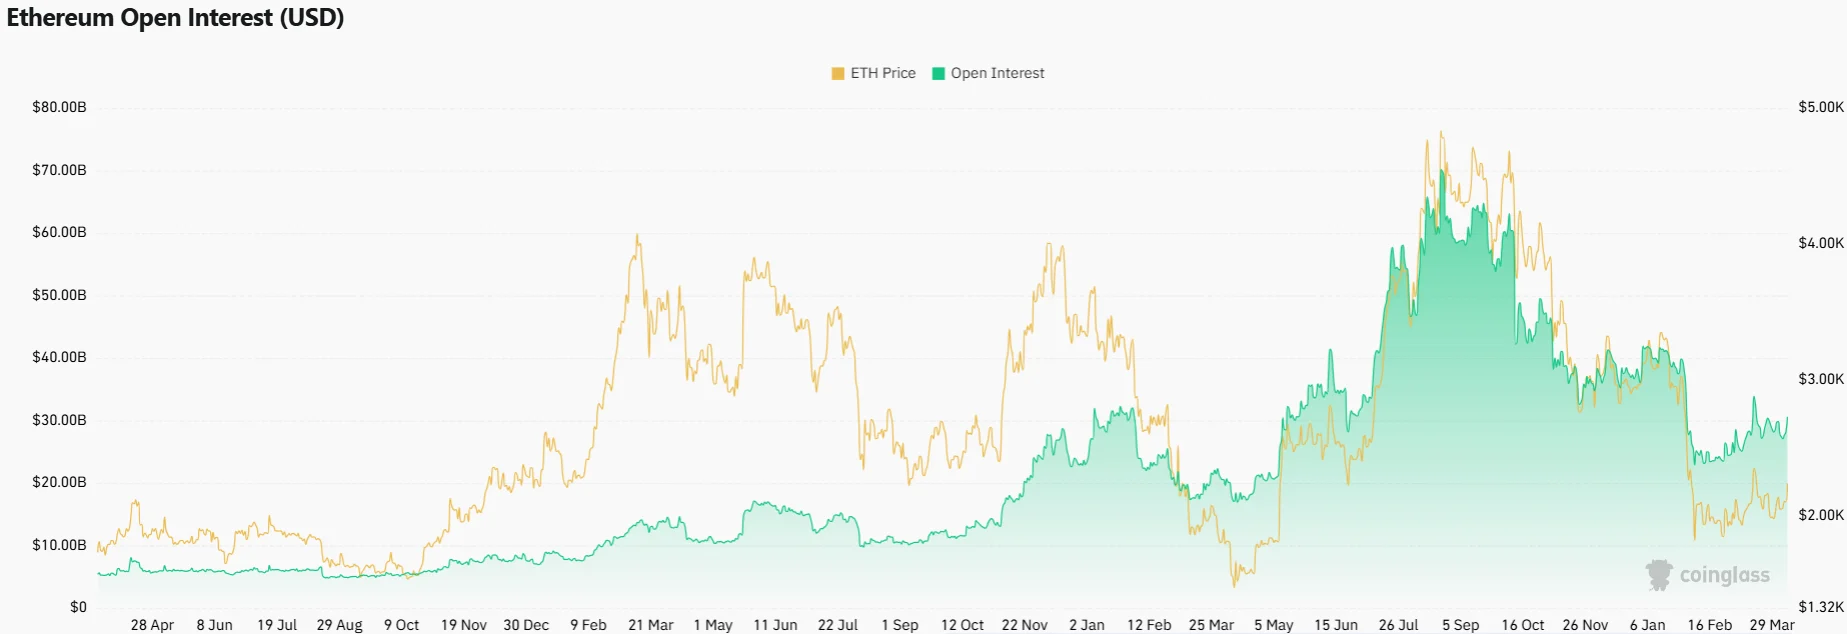
After declining to 5 million ETH in October, open interest has staged a notable recovery. This resurgence demonstrates continued engagement in derivatives trading.
Spot Ethereum exchange-traded funds similarly displayed a reversal in investor appetite. These products attracted $120 million in net positive flows on Monday, representing the largest single-day intake since mid-March.
This influx arrived after a brief withdrawal period. The renewed capital suggests American institutional investors have resumed accumulation.
Ethereum achieved a brief rally above $2,250 before encountering resistance. Technical charts reveal price breached a narrowing triangle formation near $2,150 on the hourly timeframe before pulling back.
The Significance of the $2,000 Threshold
Technical analysts maintain that Ethereum’s bullish framework remains intact provided the $1,800 to $2,000 support range holds firm. This zone coincides with the 20-day exponential moving average and the lower boundary of a symmetrical triangle pattern.
Ted Pillows suggested Ethereum could attempt another upward leg if $2,000 remains defended. Conversely, he warned that a breakdown below this threshold could trigger a descent toward new annual lows.
On-chain cost basis analysis reinforces the significance of the $2,000 region as a crucial support area. Approximately 3.5 million ETH tokens were accumulated at prices near this level.
Further downside protection exists between $1,750 and $1,800, where 1.36 million ETH changed hands. A failure at this level would target the triangle projection near $1,460.
Market Value to Realized Value (MVRV) essentially compares Ethereum's current price to the average price everyone actually paid for their $ETH.
Think of it as the "Average Receipt" for the entire market.
When the 0.80 MVRV Band is hit (currently around $1,880), it means the… https://t.co/93y0hrX297 pic.twitter.com/hQ3fpV1DTQ
— Ali Charts (@alicharts) April 7, 2026
Ali Charts highlighted in a social media post that Ethereum’s 0.80 MVRV band is positioned around $1,880. He noted this metric has historically identified zones where selling pressure diminishes and committed holders increase their positions.
For near-term trading, key support levels include $2,220, $2,165, and $2,120. Overhead resistance is located near $2,250 and $2,275, with the current price action stabilizing above the $2,200 zone.