
 Price Eyes $88 Resistance After 6% Surge — Key Levels to Monitor")
Key Takeaways
- SOL surged past the $82 and $85 marks following a bullish flag pattern breakout on hourly charts.
- The token peaked at $87.04 before experiencing a minor pullback and settling around the mid-$80s range.
- Bulls are now targeting the $87.20-$88 zone as the next critical resistance level.
- Key support levels are positioned at $83.75, followed by $82.70, with $80 serving as a crucial floor.
- Technical indicators present a mixed picture, showing short-term bullish momentum alongside weaker long-term trend signals.
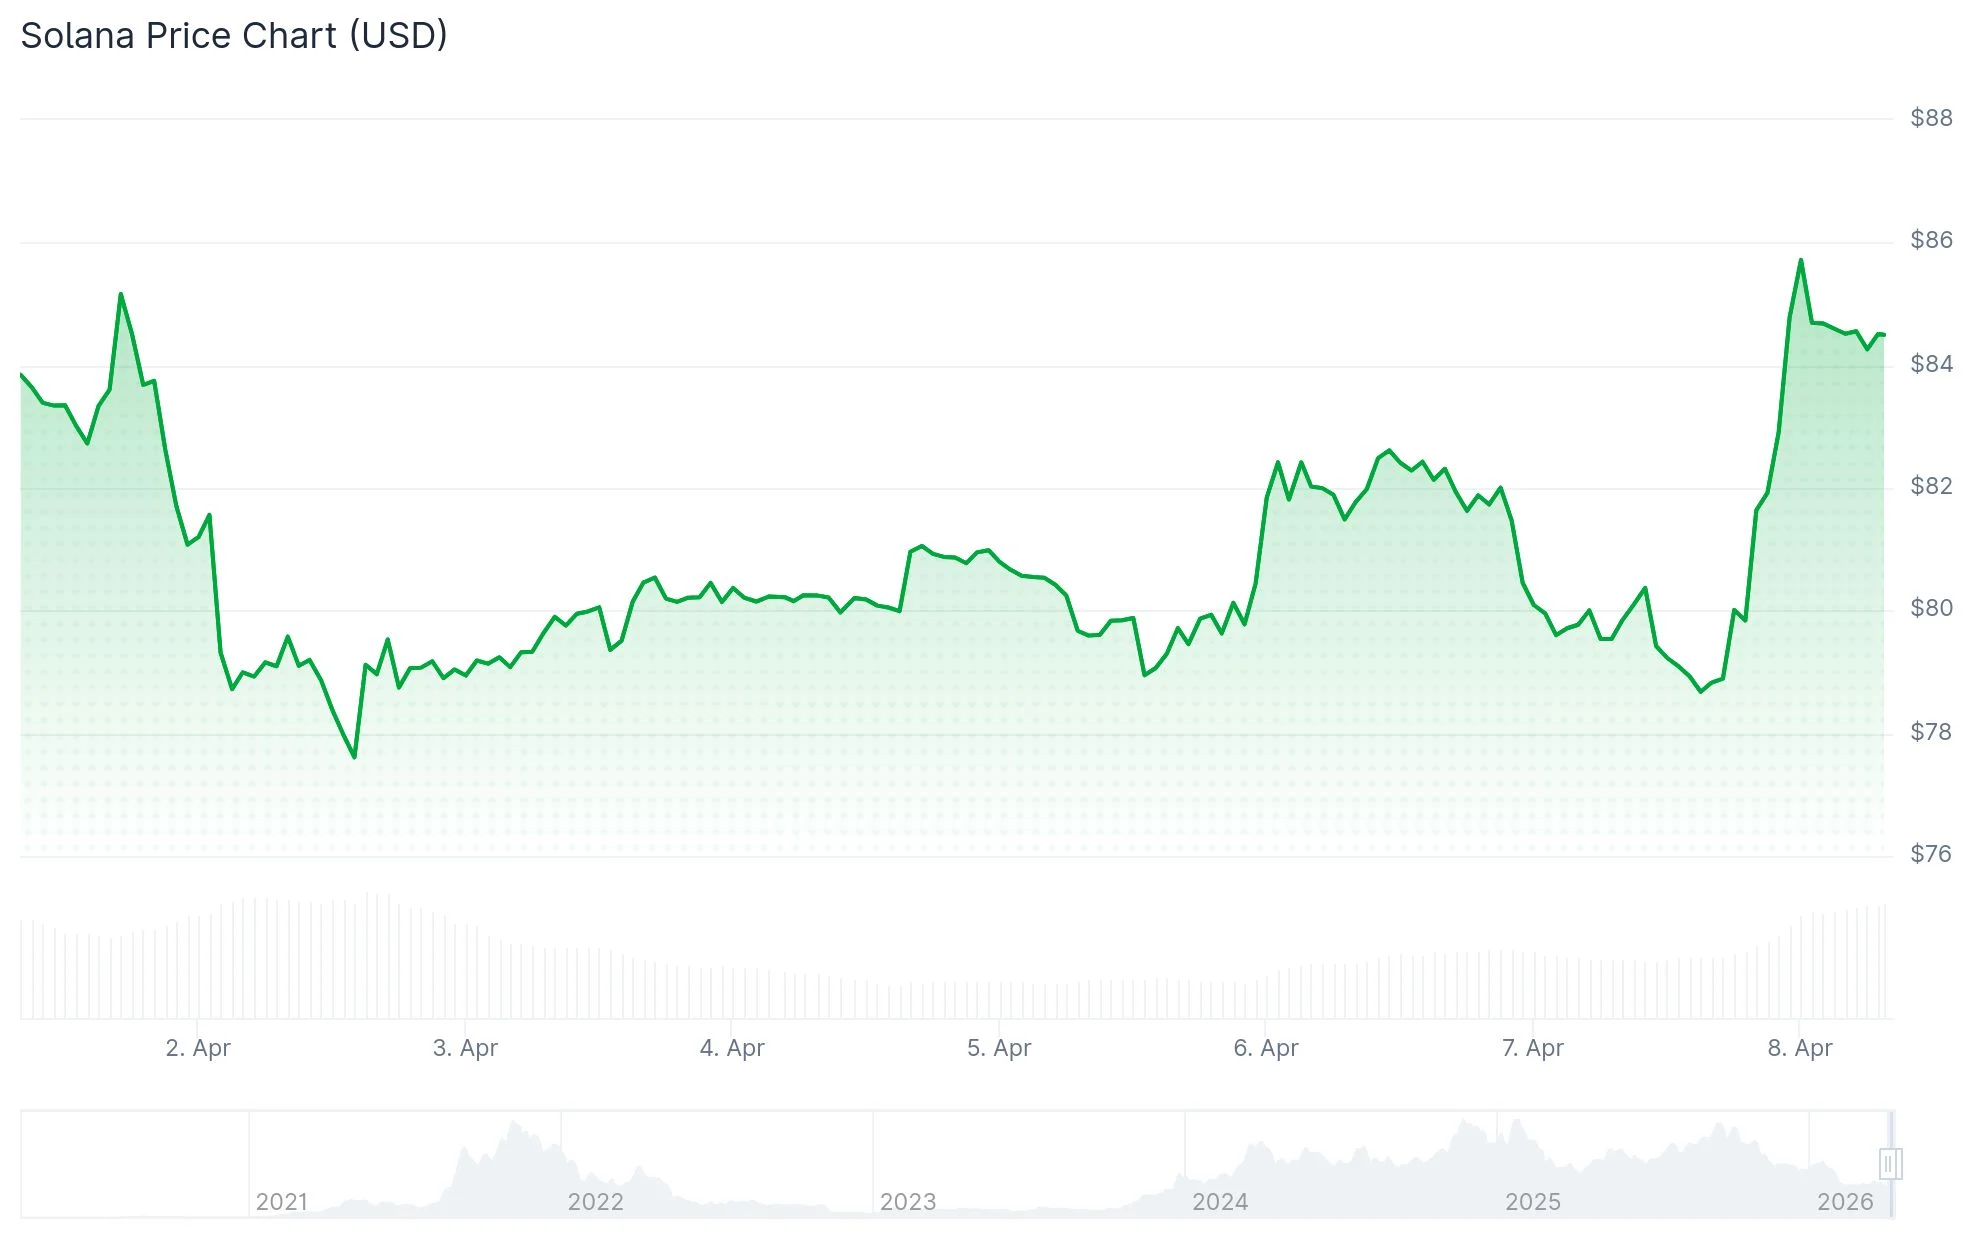
On April 8, Solana (SOL) experienced a notable upward movement as the cryptocurrency climbed beyond both the $82 and $85 price points. This advance repositioned SOL into a constructive short-term technical stance.
The cryptocurrency touched an intraday peak of $87.04 before encountering resistance and retracing modestly. Following this pullback, SOL stabilized in the $84-$85 range while maintaining the bulk of its gains.
Technical analysis of the hourly timeframe reveals that SOL successfully breached a bullish flag formation that had been capped at $80. This breakout served as the catalyst for the subsequent upward momentum.
Currently, SOL maintains its position above the 100-hour simple moving average, which reinforces the bullish case and directs trader focus toward the next overhead resistance barrier.
The immediate resistance threshold appears around $85, with the more significant challenge positioned near the $88 level.
Should buyers successfully penetrate the $88 barrier, subsequent resistance targets emerge at $95 and $102. A sustained rally beyond these points could potentially pave the way toward $112.
Recent Rally Encounters Technical Hurdles
According to additional market analysis, SOL posted a 5.85% daily gain, bringing its price to approximately $84.18. This positioning places the asset marginally beneath both its 20-day and 50-day moving averages.
$SOL zoomed in, the red box must hold otherwise $73 is next
the good news is, we are in a falling wedge pattern which is a bullish reversal pattern.
the rising wedge played out and broke down which was a bearish pattern, now we are in a bullish reversal pattern. pic.twitter.com/2xE4wLtO7d
— Don 🐂 (@DonWedge) April 7, 2026
The analysis further noted that the 200-day moving average sits considerably higher at $134.10, while the Ichimoku Kijun line near $87.19 represents the most pressing resistance level.
This technical framework underscores the significance of the $87.20-$88 zone. At present, SOL continues its attempt to navigate through this critical price range.
Momentum indicators present a mixed technical picture. While the RSI suggests modest bullish inclination, both Stoch RSI and BBP indicators signal overbought territory following the recent price surge.
The analysis projects a probable near-term trading range between $83.50 and $86.50, barring a decisive breakout in either direction. This forecast aligns with the ongoing consolidation pattern observed after the rally.
Critical Support Zones Under Watch
Should Solana prove unable to clear the $88 resistance, downside pressure could resume. The first line of defense appears near $83.75.
A more substantial support level sits around $82.70, which corresponds with the 50% Fibonacci retracement level of the upward move from $78.38 to $87.04. Below this threshold, market participants are monitoring the psychologically important $80 level.
A definitive close beneath $80 could potentially expose the $75 zone, which would signal a reversal of the recent short-term recovery effort.
Solana $SOL is currently trapped in a consolidation channel.
After months of pressure, the price has drifted to the very bottom of its range, and the next 48 hours will likely determine the trend for the rest of April.
The Channel Parameters:
• Resistance: $96.04
• Support:… pic.twitter.com/E2bDAkjis0— Ali Charts (@alicharts) April 7, 2026
Market analyst Ali Charts observed that Solana remains confined within a broader consolidation channel, bounded by resistance at $96.04 and support at $76.66. According to his assessment, the coming 48 hours could prove decisive for April’s price trajectory, with sustained support potentially fueling a bounce toward $81 and $85, whereas a breakdown below $76.66 might trigger a decline toward $68.54.
Additional context includes recent security initiatives launched by the Solana Foundation and emerging regulatory clarity in the United States. However, the immediate technical picture remains centered on price action: SOL advanced to $87.04 and now faces a critical test of whether bullish momentum can overcome the $87.20-$88 resistance barrier.