
 Skyrockets 53% as Bitcoin Remains Flat – What’s Driving the Rally?")
Key Takeaways
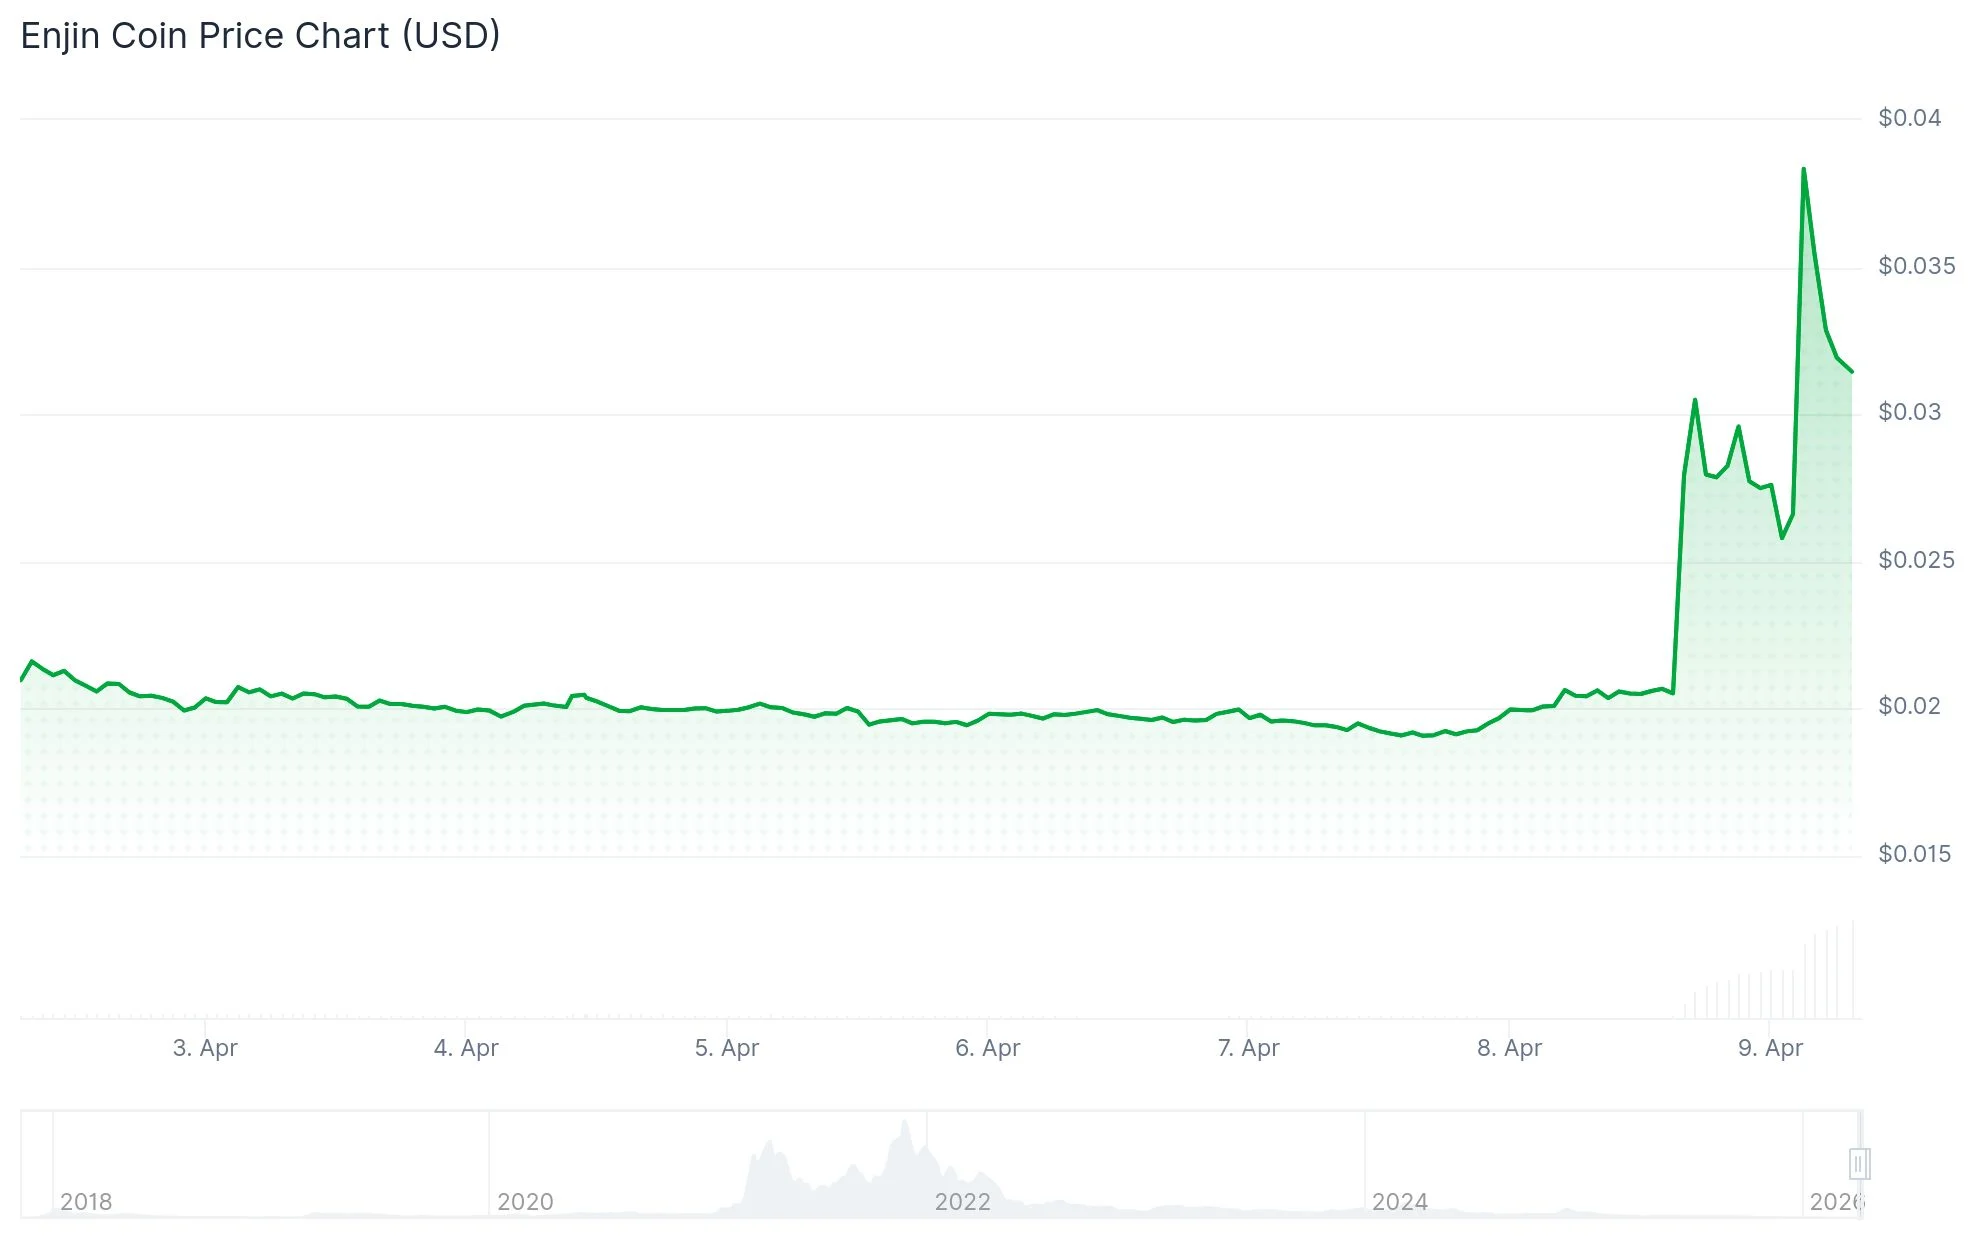
- ENJ rallied more than 53% within a 24-hour period, with prices ranging between $0.029 and $0.035
- Daily trading volume spiked to $105–$216 million, significantly exceeding typical levels
- Futures open interest climbed to an all-time high of $74.68 million from $19.82 million just 48 hours earlier
- Price appreciation was uniform across 56 trading pairs, indicating authentic market demand
- Technical indicators show RSI approaching 82, pointing to overbought territory that may limit upside
Enjin Coin (ENJ) delivered one of its most dramatic price surges in recent history, climbing more than 53% in a single trading session. The digital asset traded in a range between $0.029 and $0.035, with slight variations depending on the platform and specific time interval examined.
What makes this price movement particularly noteworthy is its occurrence during a period when Bitcoin experienced only marginal appreciation. This divergence strongly indicates that ENJ-specific catalysts, rather than general cryptocurrency market momentum, fueled the buying pressure.
Volume metrics painted a compelling narrative. According to Santiment’s ecosystem data, ENJ registered $216.97 million in trading activity on Thursday — marking the highest level observed since April 2025. Meanwhile, MEXC exchange data documented $105.7 million in 24-hour volume against a market capitalization of merely $57.8 million.

This translates to a volume-to-market-cap ratio ranging from approximately 1.8x to 2.1x. For context, sustainable market activity typically falls within the 0.1x to 0.5x range.
Futures Market Shows Unprecedented Growth
Derivatives market indicators further validated the bullish momentum. According to CoinGlass analytics, open interest in ENJ futures contracts surged to $74.68 million on Thursday, representing a substantial increase from the $19.82 million recorded on Tuesday. This expansion in open interest typically signals fresh capital flowing into the asset.

The rally demonstrated remarkable consistency across different trading venues. Analysis of 56 separate currency pairs revealed gains ranging from 37.97% to 43.68%, with a standard deviation of merely 1.8 percentage points. This uniformity strongly suggests widespread demand rather than isolated exchange-specific activity.
From a technical analysis perspective, ENJ successfully reclaimed positions above both its short-term and medium-term exponential moving averages. The 200-day EMA hovering around $0.035 represents the immediate overhead resistance level. The Relative Strength Index on the daily timeframe approached 82, indicating the asset has entered overbought territory.
$ENJ just pumped another 44% in 15 minutes — insane volatility.
Point to remember: This altcoin is still 99% down from its December 2021 all-time high.
No major news or catalyst visible yet.
Such violent spikes are very common in low-volume coins. Classic market maker play —… pic.twitter.com/8uY1Llg1JO
— Neel (@NeelMacro) April 8, 2026
The MACD histogram displayed strong positive momentum, confirming bullish short-term dynamics. Should ENJ maintain support above the 23.6% Fibonacci retracement at $0.031, potential upside targets include $0.051, $0.066, and $0.082.
Blockchain Metrics and Warning Signals
Blockchain analytics revealed a network growth index of 71, representing the highest reading since August 2025. Large holder activity intensified as well, with wallet engagement from whales increasing in tandem with price appreciation.
Nevertheless, CryptoQuant data highlighted preliminary indications of buyer fatigue. Futures market analysis suggested increased retail participation accompanied by negative sentiment readings, while sell-side pressure became apparent in both spot and derivatives markets.
ENJ currently maintains a market capitalization ranking between #406 and #416, a significant decline from its top-50 position during the 2021 NFT market boom. With a market cap hovering around $54–$58 million, the token remains approximately 94% below its historical peak valuation.
The critical resistance zone to monitor spans $0.033 to $0.038. A convincing breakout above this range could catalyze additional upward movement, whereas a decline beneath $0.025 may precipitate a more substantial correction.