
 Price Analysis: Critical Support Zones Under Spotlight as User Base Peaks")
Key Takeaways
- Solana’s user base climbed to an unprecedented 166.9 million addresses in April 2026, marking a 12% gain since October
- Realized capital outflows totaled $18.2 billion from October 2025 through present
- Critical support zones identified at $75–$77 and $61.78 across multiple timeframes
- Price action faces a ceiling at $92–$94, with extended upside potential targeting $183
- Token rallied approximately 7% following Iran ceasefire announcement, touching $87 before retracing
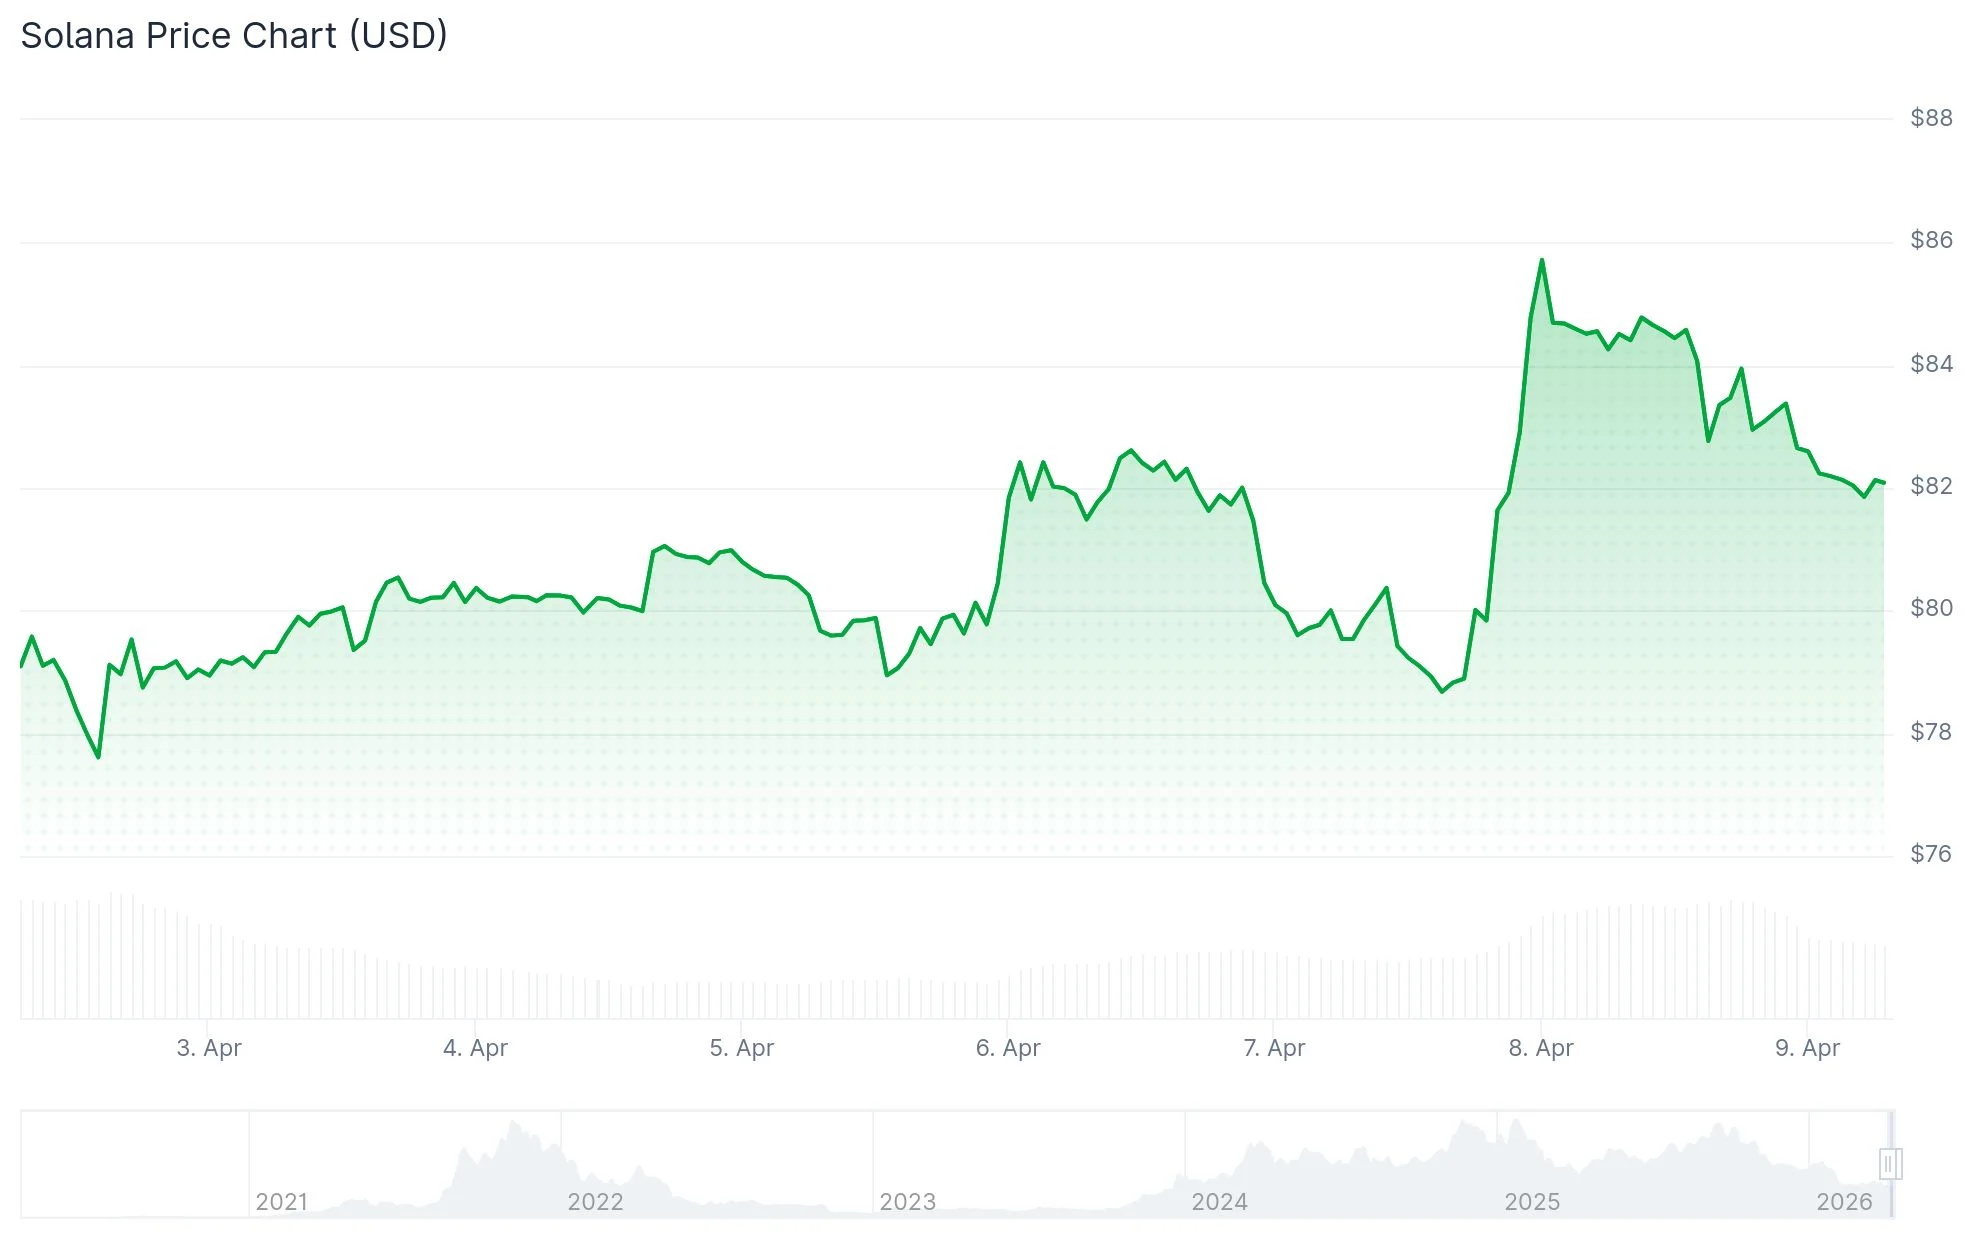
Solana continues to trade within a narrow corridor as market observers monitor pivotal technical boundaries. The digital asset fluctuates between $79 and $84, caught between demand protecting lower thresholds and supply pressure limiting upward momentum.
Crypto analyst Ali Martinez identifies SOL maintaining position within an established channel structure, with overhead resistance positioned at $96.04 and foundational support at $76.66. Breaking beneath $76.66 could trigger a descent toward the year’s lowest point of $68.54, with potential extension to $50. Maintaining above this threshold may fuel a recovery toward $81–$85.
Solana $SOL is currently trapped in a consolidation channel.
After months of pressure, the price has drifted to the very bottom of its range, and the next 48 hours will likely determine the trend for the rest of April.
The Channel Parameters:
• Resistance: $96.04
• Support:… pic.twitter.com/E2bDAkjis0— Ali Charts (@alicharts) April 7, 2026
Examining shorter timeframes, MCO Global’s one-hour chart analysis highlighted rejection occurring at the $80.44–$84.72 Fibonacci retracement zone. This development places emphasis on the $75 region as the subsequent significant support should downward pressure persist. Downside markers to watch include $77.91, $75.38, and $71.91.
The asset experienced temporary momentum following ceasefire developments in Iran, climbing roughly 7% from $78 to $87. However, this strength proved fleeting as prices retreated back toward the range lows.
Token Holders Reach Unprecedented Milestone
Contrary to price weakness, Solana’s holder count achieved a record peak of 166.9 million addresses in April 2026. This represents an 8.2% expansion from 154.2 million recorded at 2025’s conclusion, and a 12% surge from the 148.9 million figure in October. SOL currently occupies the fourth position among Layer 1 tokens by holder count, trailing BNB, ETH, and TRX.

Persistent Capital Flight Presents Challenge
The Realized Cap metric, which tracks net capital investment, declined from $96.9 billion to $78.5 billion since October—representing an $18.2 billion exodus. This data point underscores continued distribution activity despite expanding holder metrics.
CoinShares data reveals SOL captured $34.9 million in investment inflows during the previous week, though XRP secured approximately four times that volume at $120 million.
Market analyst R4 XBT observed on X that Solana currently trades at its 50-day moving average, identifying this as a critical juncture for the ongoing consolidation pattern. A sustained close above this technical indicator could signal the beginning of an upward breakout.
On extended daily timeframes, analyst DonWedge identifies an ascending support trendline near $61.78 paired with a descending resistance trajectory targeting $183. SOL remains confined within this converging pattern, with neither direction confirming a definitive breakout.
Current market data shows SOL hovering around $79, where record-breaking adoption figures contrast with ongoing capital withdrawal and repeated rejection at the $92–$94 supply zone.