
 Hits $2,100 as MVRV Metric Signals Historical Buying Opportunity")
Key Takeaways
- ETH’s MVRV ratio has moved into the 0.8-1.0 range, a historically significant accumulation zone that has preceded major rallies
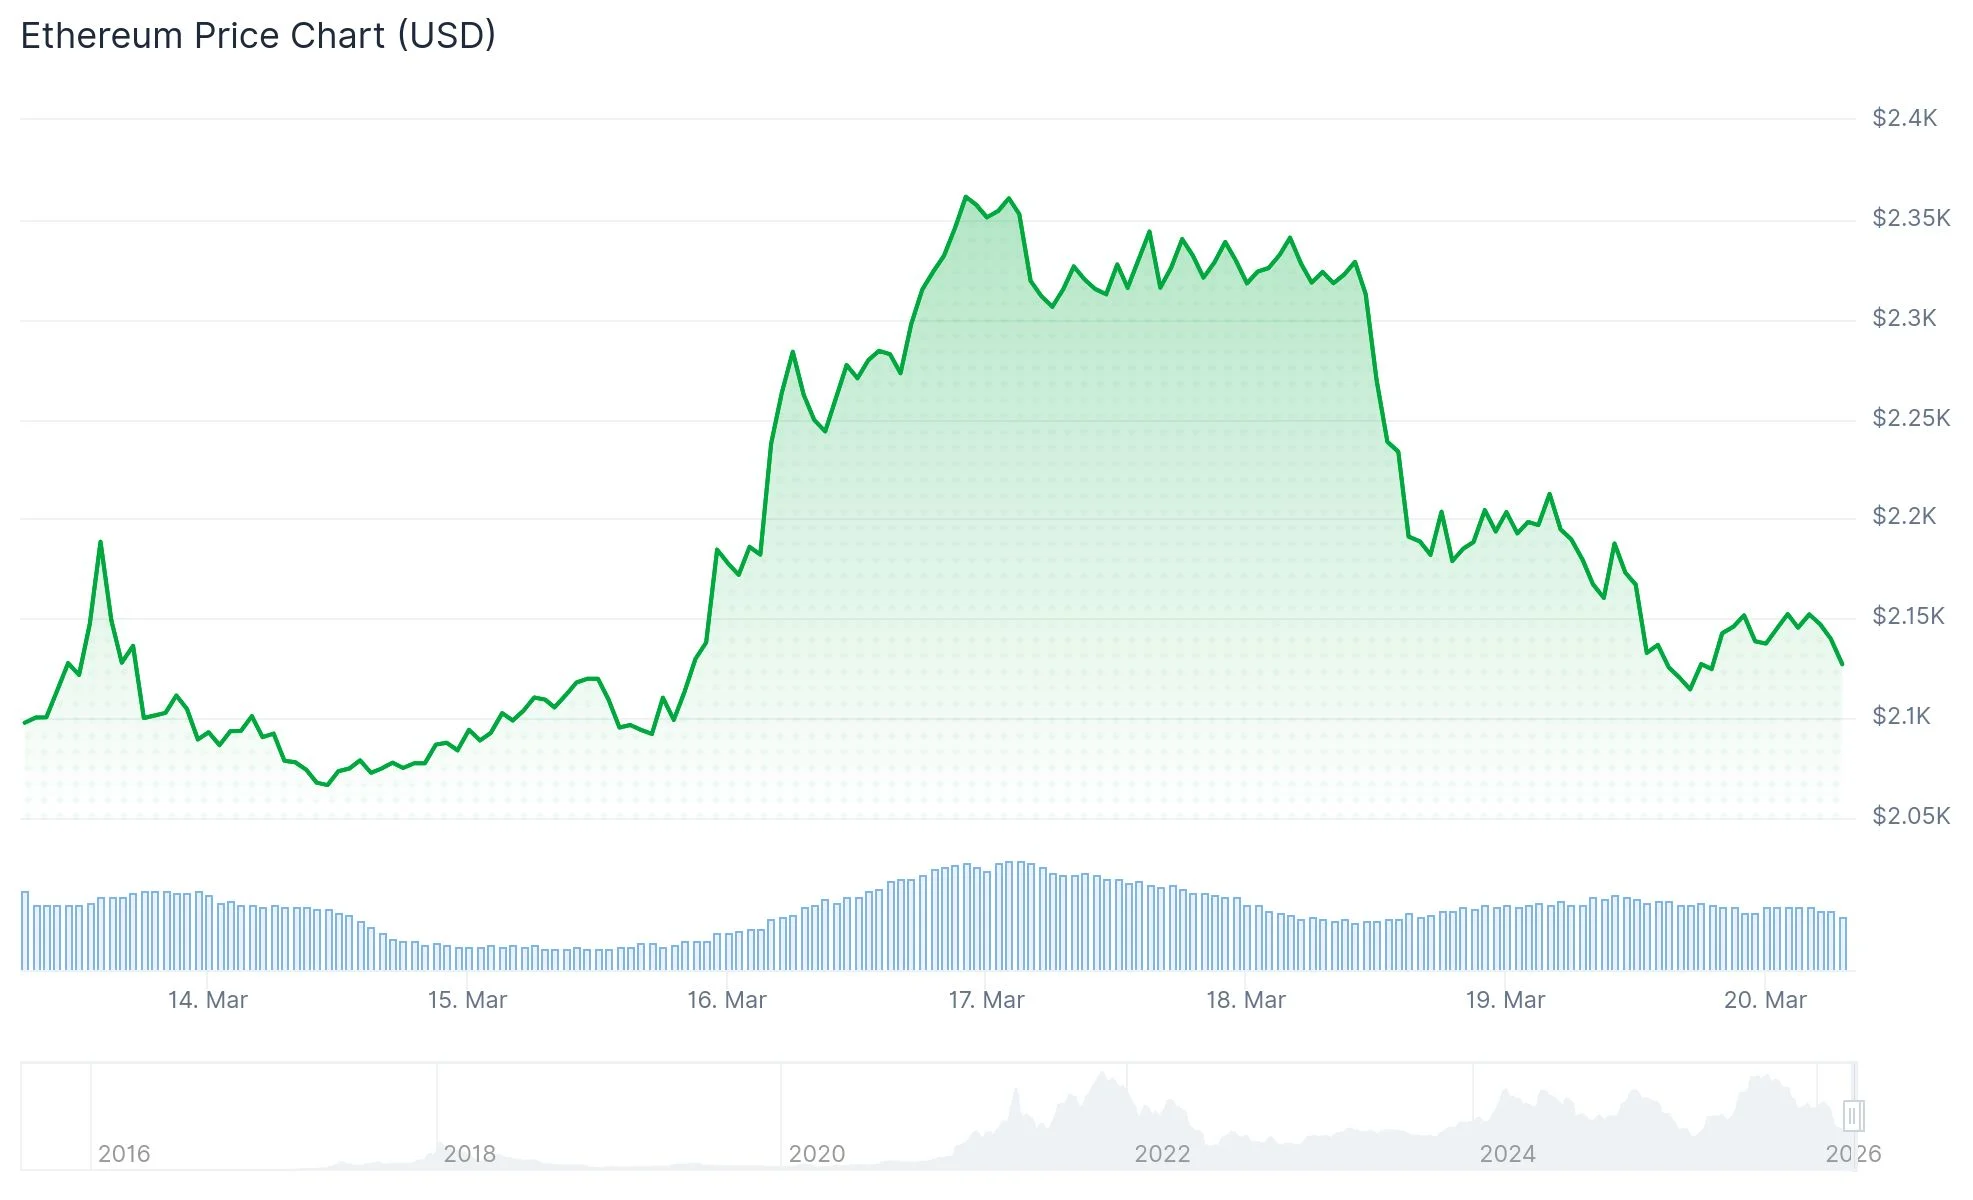
- Ethereum faced strong selling pressure at $2,400 and declined sharply to reach $2,100
- Current trading activity remains below the $2,200 mark and beneath the 100-hourly Simple Moving Average
- Critical near-term support exists between $2,100 and $2,150, with secondary support around $1,770 if breached
- Breaking above $2,200 could trigger upward movement toward $2,240, $2,275, and possibly $2,385
Ethereum has pulled back to approximately $2,100 following a significant decline from the $2,385 region. The cryptocurrency descended below multiple price levels including $2,320 and $2,250, eventually breaking through an important ascending trend line that provided support near $2,160 on the 60-minute chart.
The recent bottom touched $2,100, with current price action hovering marginally above this threshold. ETH is positioned below the 23.6% Fibonacci retracement level calculated from the downward move between $2,385 and $2,100.
Additionally, Ethereum remains underneath the 100-hourly Simple Moving Average, reinforcing the near-term bearish momentum in play.
Immediate overhead resistance appears at $2,165, with the next significant barrier at $2,200, coinciding with the 100-hourly SMA. Reclaiming the $2,200 level represents a crucial initial milestone for bulls attempting a reversal.
Should Ethereum successfully breach $2,200, subsequent resistance zones include $2,240, which aligns with the 50% Fibonacci retracement level, followed by $2,275 and $2,320. A more robust upward move could potentially test $2,385.
Conversely, failure to maintain $2,100 would expose lower support areas at $2,060 and $2,020. The psychological $2,000 threshold is widely regarded as a critical support foundation.
Historical MVRV Zone Signals Potential Value Opportunity
From a broader perspective, Ethereum’s Market Value to Realized Value (MVRV) ratio has declined into the 0.8-1.0 territory. Data analyst Ali Charts, utilizing Glassnode metrics, highlights that this range has historically preceded significant multi-month upward trends.
https://twitter.com/alicharts/status/2034559606668570900?s=20
Historical recoveries from this MVRV zone have varied considerably, ranging from approximately 129% to exceeding 5,000%, though market conditions differed substantially in each instance. While this metric doesn’t guarantee an immediate price surge, it indicates that further downside potential may be constrained compared to levels observed near previous market peaks.
ETH achieved a cyclical peak around $4,955 before entering this corrective phase. The current valuation near $2,100 reflects a decline exceeding 57% from that all-time high.
Market Observer Identifies $2,150 as Critical Threshold
Market analyst Ted Pillows shared insights on X regarding Ethereum’s technical positioning. His analysis highlights that ETH experienced forceful rejection at the $2,400 resistance area and is currently testing $2,150 as a possible support foundation.
https://twitter.com/TedPillows/status/2034554720593772615?s=20
The technical chart presented by Ted Pillows illustrates a series of descending peaks, with successive rallies unable to achieve substantial upward progress. This formation maintains the possibility of additional downside should support levels fail to hold.
The $2,150 area corresponds with a previous consolidation zone and is attracting attention as a near-term directional pivot point.