
 Struggles Below $85 as ETF Withdrawals Surpass $17M This Week")
Key Takeaways
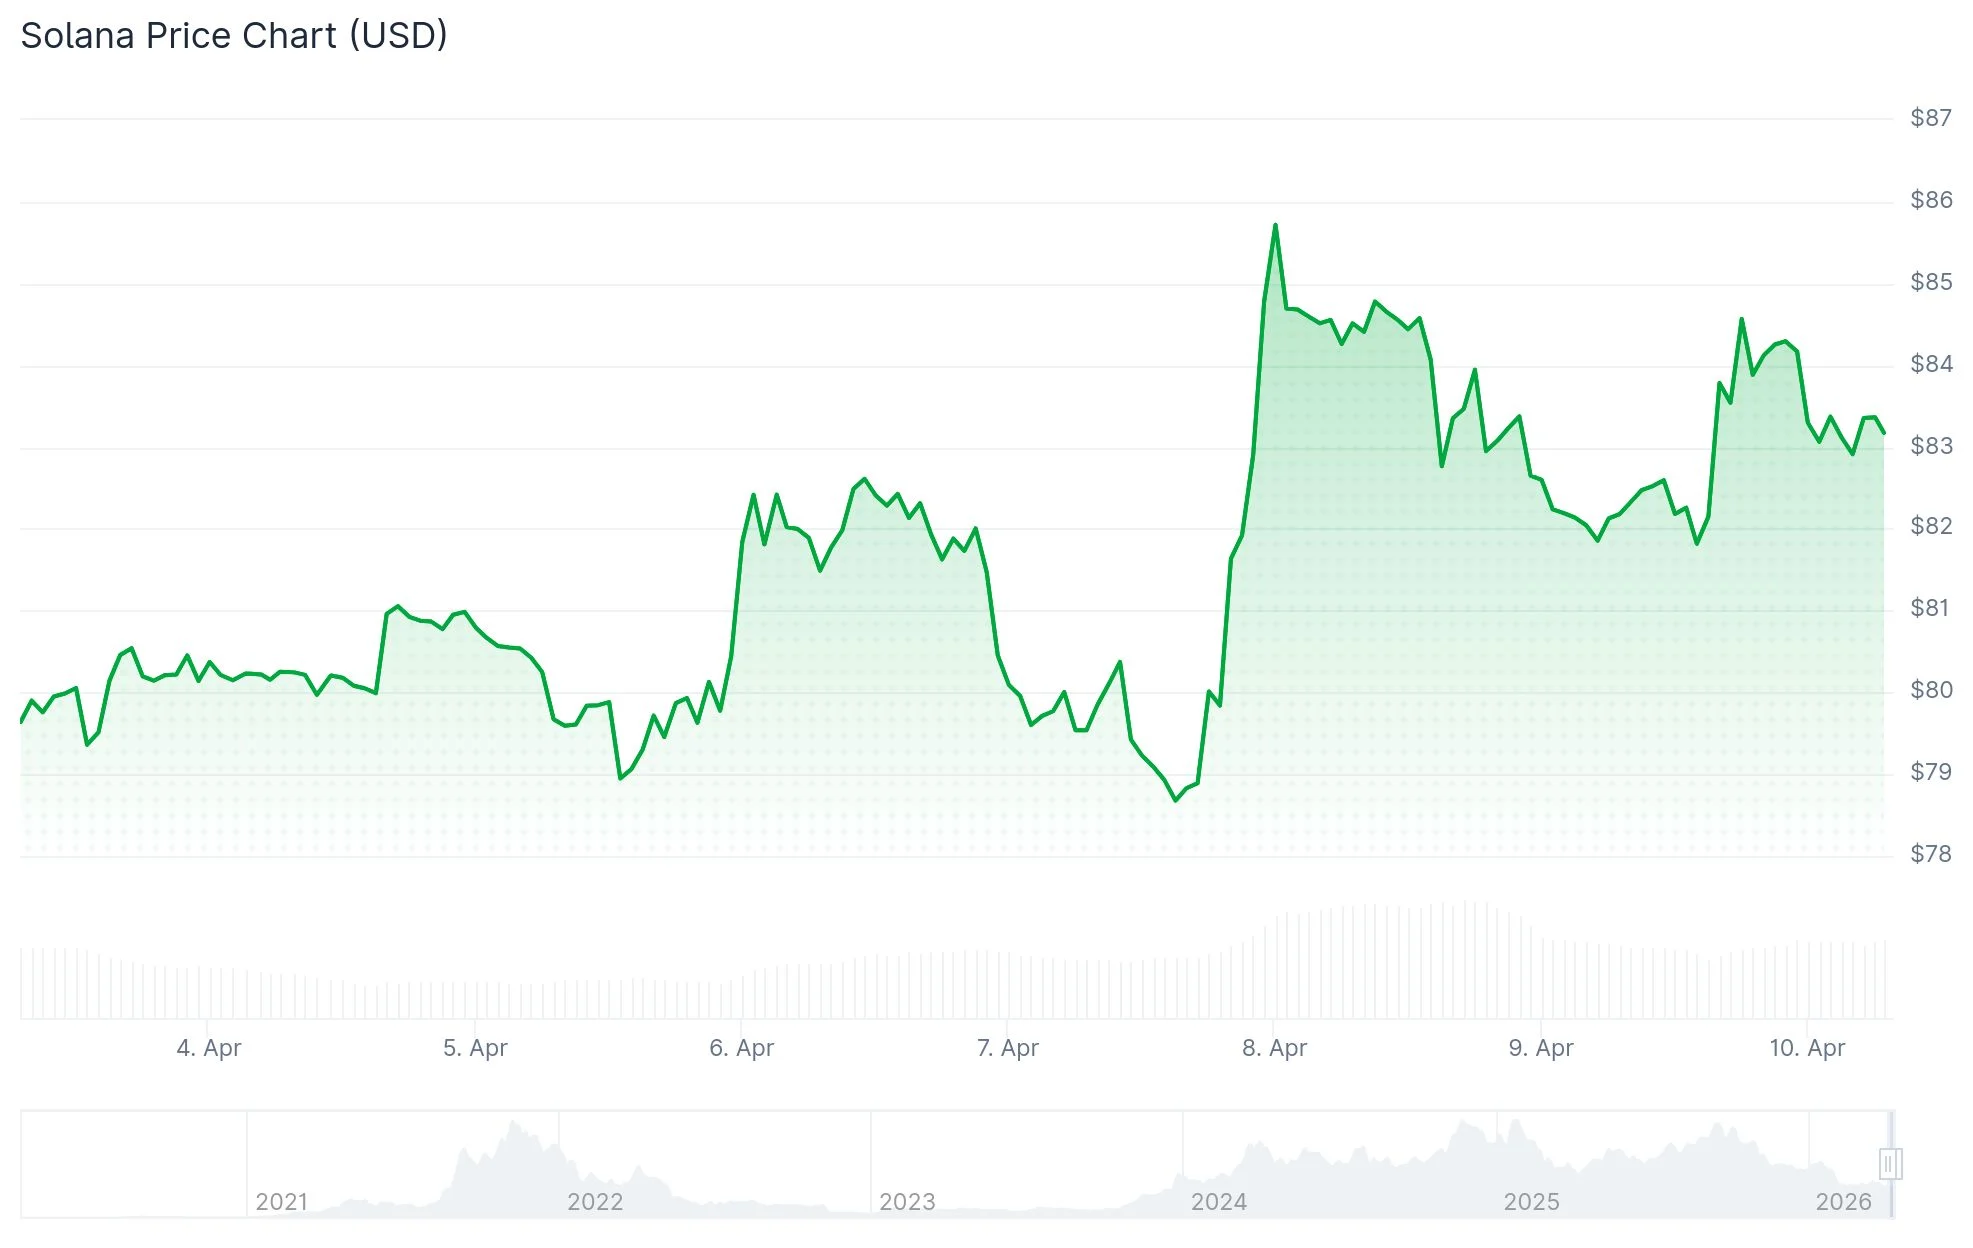
- Solana is currently changing hands near $83, trapped beneath a downward trendline and critical moving average levels
- Weekly outflows from Solana ETFs totaled $17.08 million, featuring a historic single-day withdrawal of $15.40 million on Tuesday
- Liquidations in the past day reached $7.99 million, with the majority affecting short positions
- The 50-day EMA positioned around $87–$88 represents the crucial resistance barrier for bulls
- Crypto analyst Ali Martinez identified a recurring price behavior where SOL temporarily recovers the 50-day MA before declining again
Solana is currently hovering near $83 on Friday, April 10, maintaining its position above the $80 floor but encountering difficulty gaining upward momentum. The cryptocurrency remains beneath its 50-day, 100-day, and 200-day Exponential Moving Averages (EMAs), creating a neutral to bearish short-term technical setup.
An overhead descending trendline drawn from the January 14 and April 7 peaks is providing resistance, aligning with the 50-day EMA in the $87 to $88 range. SOL has repeatedly failed to secure a daily close above this technical confluence zone.
The Relative Strength Index (RSI) currently reads 47, indicating subdued momentum without clear directional bias. Meanwhile, the Moving Average Convergence Divergence (MACD) displays a slightly bullish signal, though insufficient to confirm a meaningful trend reversal.
Institutional Withdrawals Reach New Heights
Institutional appetite for Solana appears to be waning based on recent ETF activity. US-listed spot SOL exchange-traded funds experienced combined outflows of $17.08 million during the current week, highlighted by Tuesday’s unprecedented single-day exodus of $15.40 million.

Persistent ETF withdrawals generally signal institutional reallocation and can exert negative pressure on underlying asset prices.
In the derivatives markets, CoinGlass reports $7.99 million in total liquidations during the last 24-hour period. Short positions accounted for $5.97 million of these liquidations, indicating bearish bets were predominantly eliminated. Open Interest declined 1.48% to settle at $4.78 billion, signaling decreased market participation.
The OI-weighted funding rate holds at a marginally positive 0.0038%, while the long-to-short ratio stands at 1.0141, demonstrating a slight tilt toward bullish positioning among active traders.
Technical Analyst Identifies Recurring Breakdown Pattern
Cryptocurrency analyst Ali Martinez shared observations on X regarding a pattern that has materialized three separate times since November 2025. In each instance, SOL momentarily recaptured the 50-day Moving Average before failing to sustain levels above it, ultimately leading to consolidation followed by pronounced selling pressure.
I’ve been tracking a specific structural pattern for Solana $SOL that has been remarkably consistent since October 2025.
It’s a three-step cycle that seems to repeat every time we lose momentum.
The Anatomy of the Pattern:
• The Reclaim: SOL rallies and manages to close… pic.twitter.com/Xj6GftpKun
— Ali Charts (@alicharts) April 8, 2026
Martinez emphasized that extended periods trading below the 50-day MA historically increase the probability of another downward move according to recent price action.
Solana has been confined to a trading range between $78 and $92 throughout most of the period following March 5’s volatile session, during which the price plunged from $92 to $78 within hours.
On the bullish scenario, a confirmed daily close above $88 could unlock movement toward the 100-day EMA positioned near $99.86. Conversely, if SOL breaks down below $80, subsequent support zones emerge at $76.50 and potentially $47.90, which AMBCrypto previously identified in February as a longer-term downside objective based on weekly chart analysis.
Immediate resistance for SOL sits at $85, followed by $88. Critical support levels include $82.50, $81.40, and $80.