
 Price: Is a 30% Breakout Imminent as Triangle Pattern Tightens?")
KEY HIGHLIGHTS
- DOGE slipped beneath $0.0930, reaching lows around $0.0903
- Current trading occurs below the 100-hourly simple moving average
- 4-hour chart reveals formation of descending triangle pattern
- Crypto analyst Ali Martinez highlights increasing probability of 30% price movement
- MACD indicator triggered “Buy” signal; RSI and Bull Bear Power stay Neutral
Dogecoin has experienced a pullback following its inability to maintain support above the $0.0930 threshold. The digital asset declined through critical support territories, bottoming out near $0.0903 before staging a modest rebound. Currently, DOGE trades beneath both $0.0920 and its 100-hourly simple moving average.
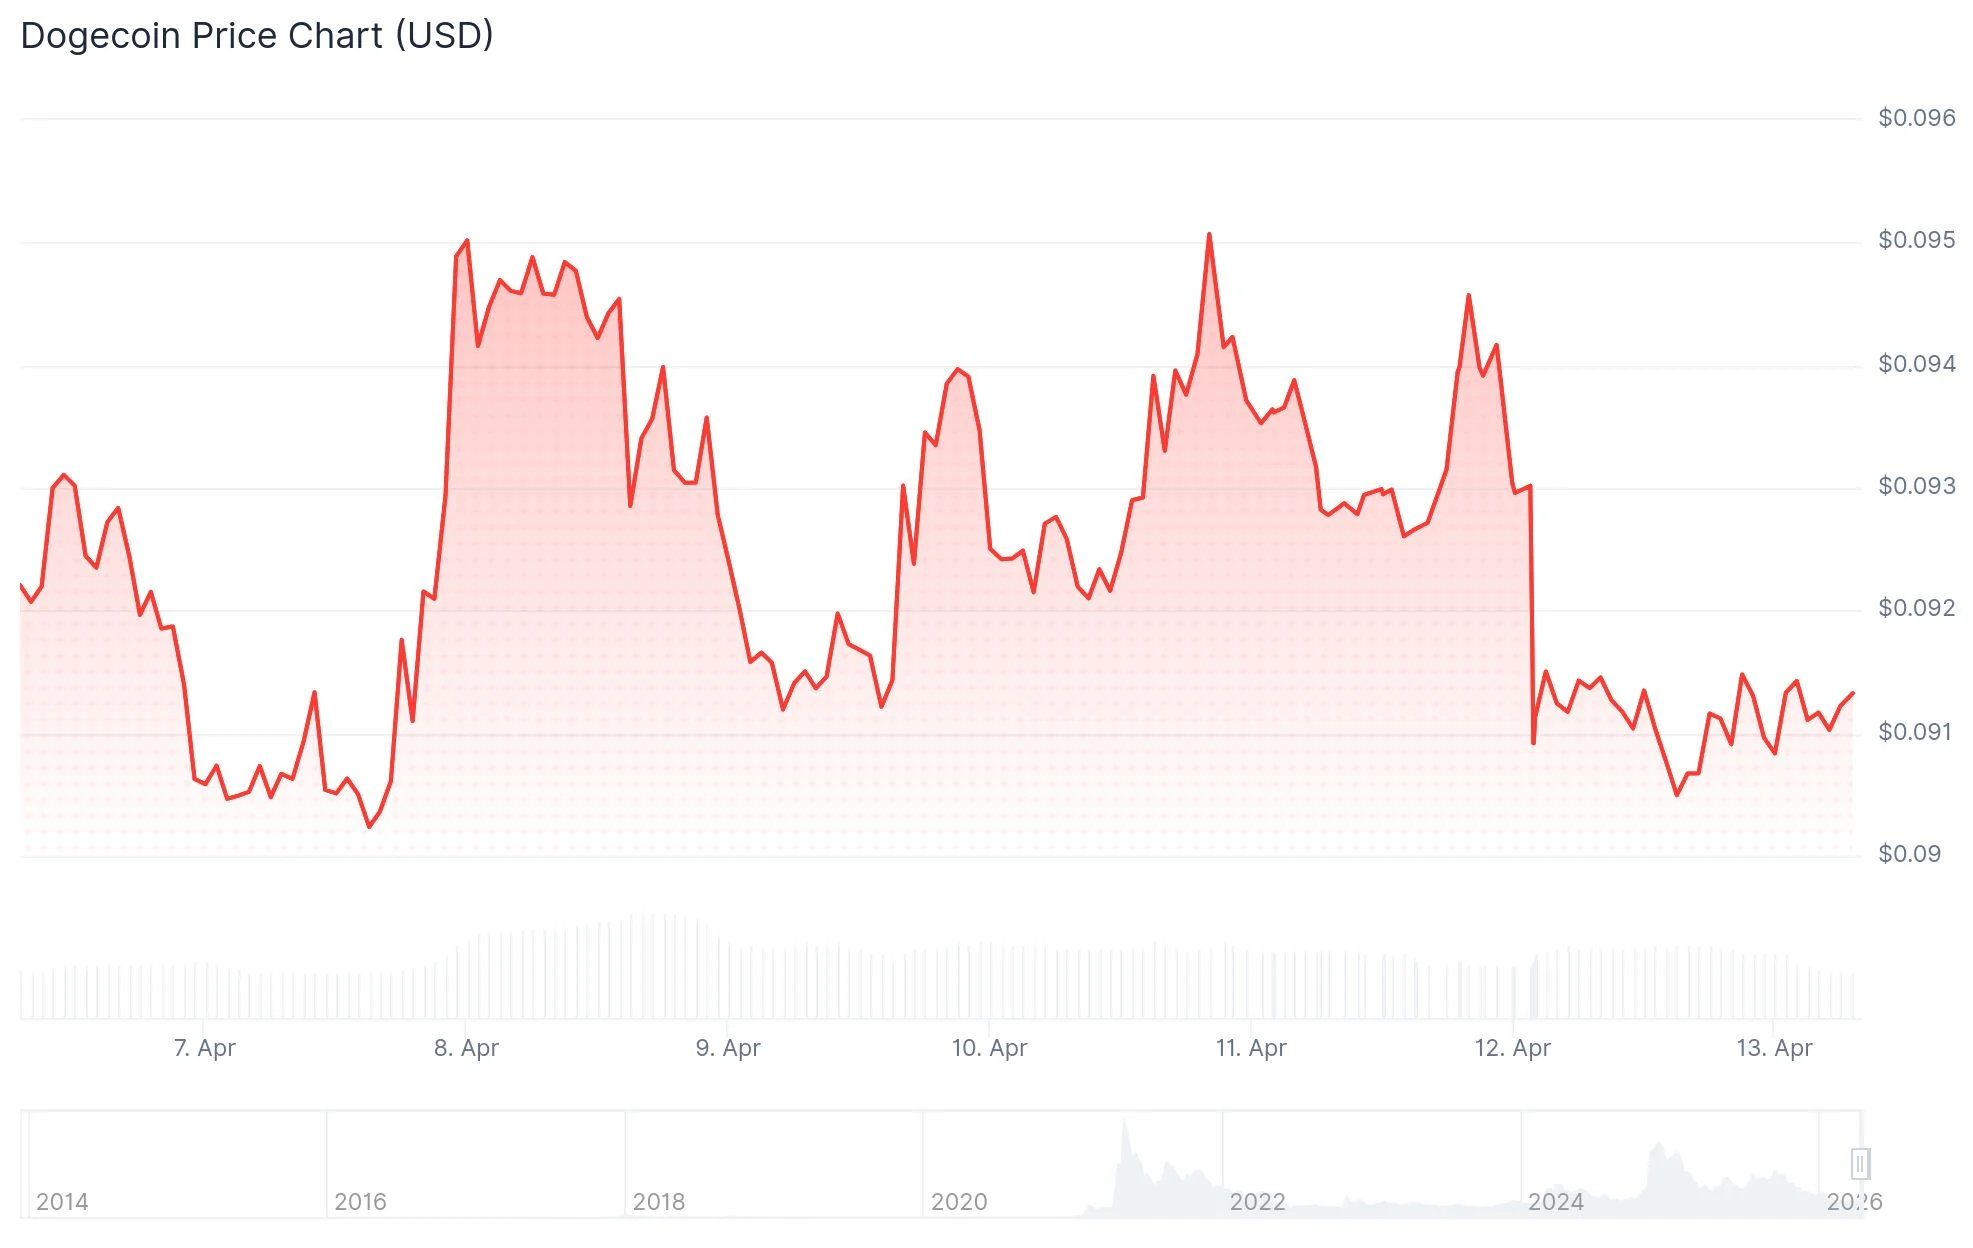
A bullish trendline positioned at $0.0925 was violated on the hourly timeframe, introducing additional downward pressure to near-term price action. The subsequent relief rally lost momentum below the 23.6% Fibonacci retracement level of the decline from $0.0948 down to $0.0903.
Looking at resistance levels, the initial hurdle emerges at $0.0925, coinciding with the 50% Fibonacci retracement of the recent downward move. Further overhead resistance exists at $0.0930 and $0.0938. A successful breach of these zones could pave the way toward $0.0950 and potentially $0.0980.
Regarding support levels, $0.0905 represents the immediate cushion. Below this lies $0.0900, with significant foundational support anchored at $0.0880. Should DOGE penetrate below $0.0880, further declines toward $0.0820 or even $0.0800 become plausible.
Technical Analyst Identifies 30% Movement Probability
Cryptocurrency market analyst Ali Martinez shared observations on X dated April 12, drawing attention to a descending triangle configuration visible on DOGE’s 4-hour chart. Martinez stated: “As Dogecoin $DOGE moves closer to the apex of this triangle, the chances of a 30% move increase substantially.” The analyst refrained from indicating whether this anticipated movement would be bullish or bearish. Should the breakout materialize upward, a 30% appreciation would position DOGE around $0.11, approaching price levels last witnessed during early February.
As Dogecoin $DOGE moves closer to the apex of this triangle, the chances of a 30% move increase substantially. pic.twitter.com/4hQ4t2heDo
— Ali Charts (@alicharts) April 12, 2026
This marks a recurring theme in Martinez’s recent technical assessments. The analyst has consistently emphasized this triangle configuration across multiple recent reports.
Futures Market and Technical Indicators
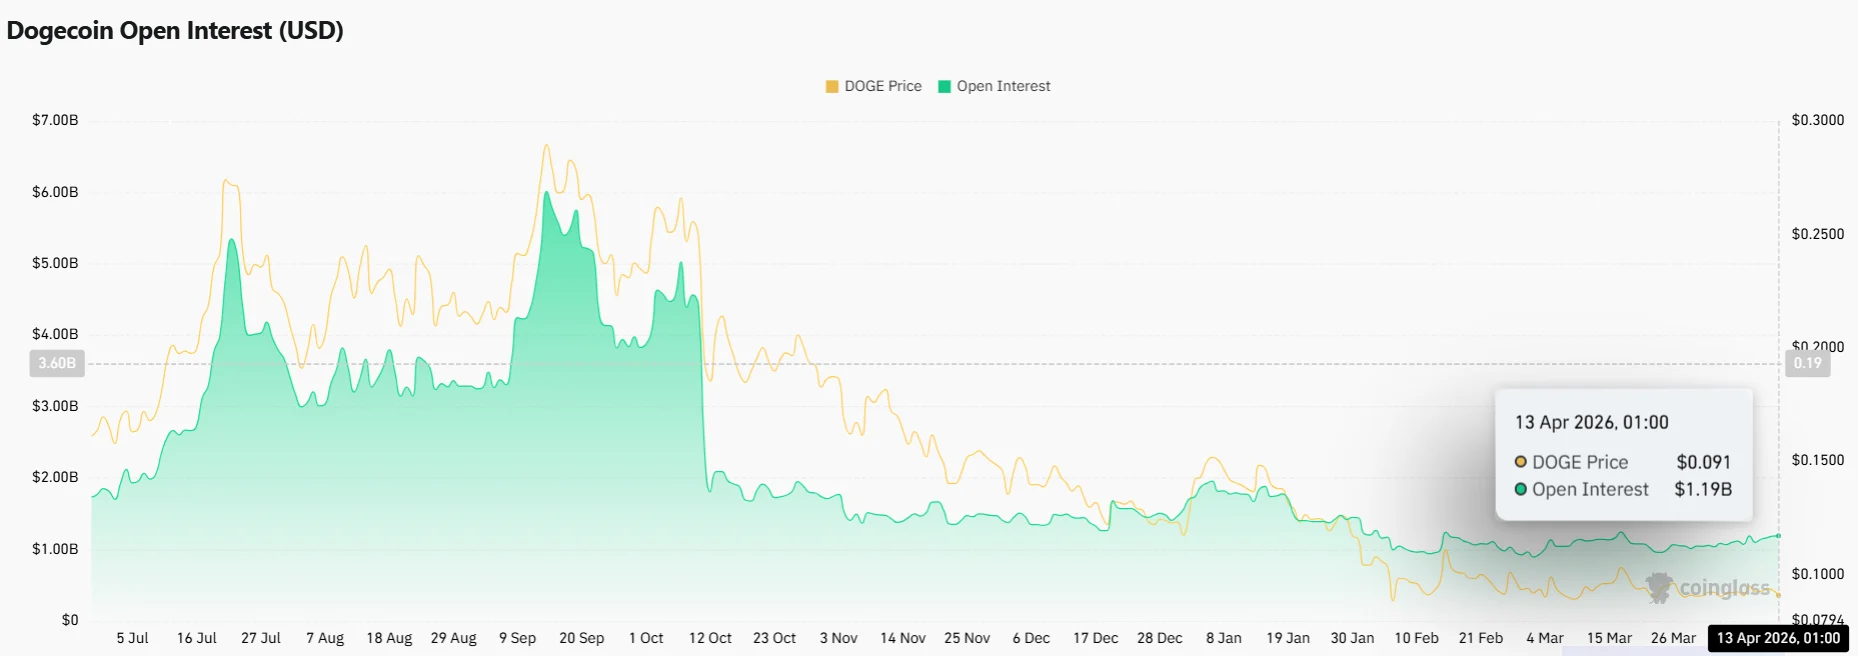
Open interest across DOGE futures climbed by 1.61% during the previous 24-hour period, based on Coinglass analytics. Escalating open interest coupled with lateral price movement typically suggests a consolidation period preceding a substantial directional shift.
Large-scale traders operating in the derivatives marketplace maintained bullish positioning. Meanwhile, retail trader sentiment transitioned to “Neutral.”
TradingView’s MACD indicator generated a “Buy” signal for DOGE. Both the Bull Bear Power indicator and Relative Strength Index registered Neutral readings.
Dogecoin has predominantly exhibited sideways trading patterns throughout April, with wider cryptocurrency market headwinds constraining price within a defined range. According to Coinglass metrics, open interest in DOGE futures contracts expanded by 1.61% over the last day.