
 Approaches Critical Price Level as Network Surpasses $1 Trillion Milestone")
Key Takeaways
- SOL confronts critical resistance between $84–$87, with crucial support established in the $78–$82 range
- Technical analysis reveals a weekly broadening pattern suggesting potential cycle peak above $1,000
- The network achieved an unprecedented milestone with $1.1T in quarterly economic throughput during Q1 2026
- Daily active addresses surged to 5.5–5.8 million, significantly exceeding the 3–4 million baseline from Q4 2025
- Daily transfer activity exploded to $75 billion while token valuation remains disconnected from network growth
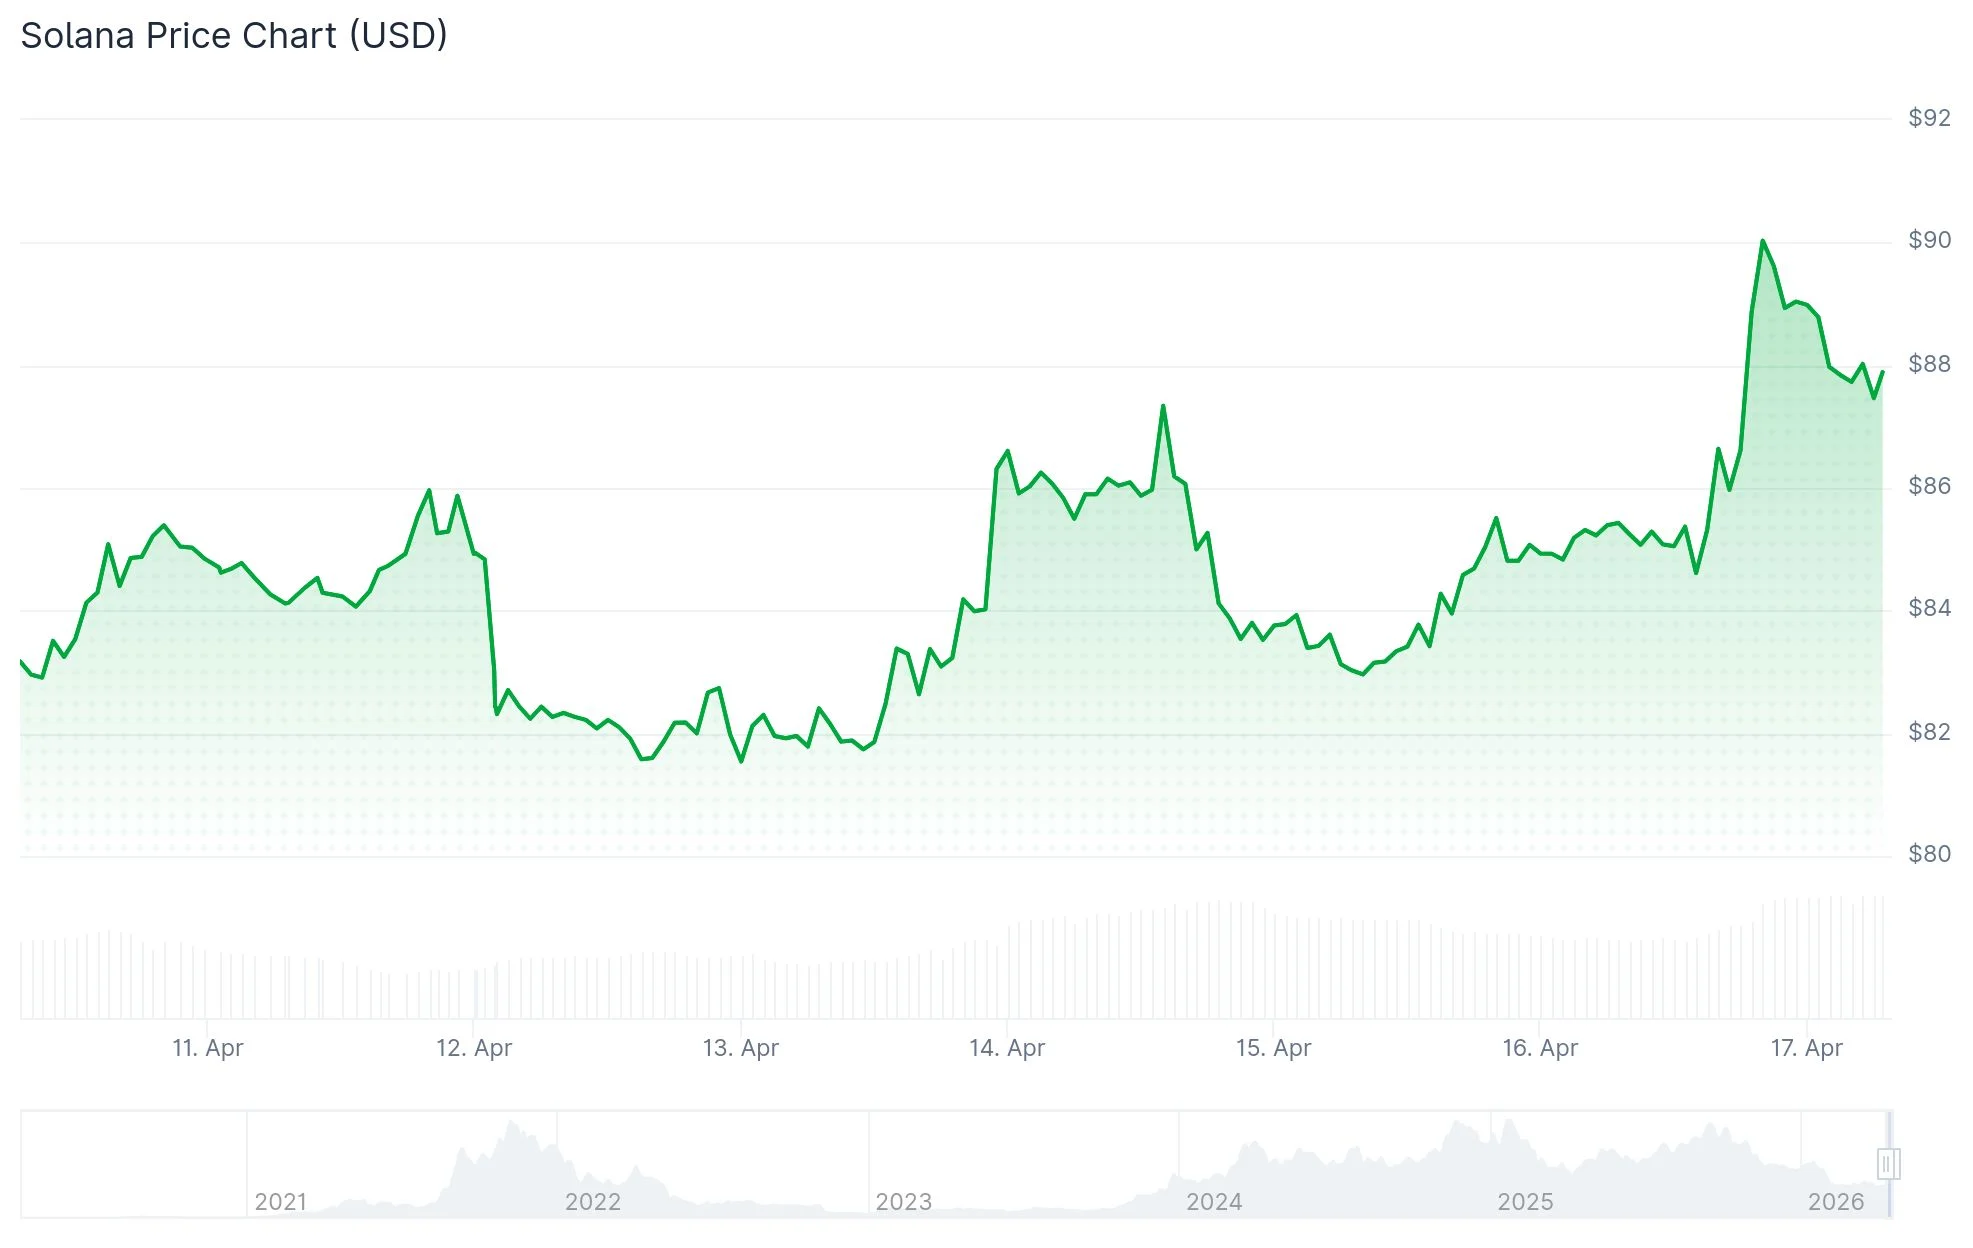
Solana finds itself at a crucial technical juncture. The 1-hour chart shows SOL approaching a resistance cluster around the mid-$84 level following a recovery from the $78 to $81 support corridor.
Multiple Fibonacci retracement levels converge in this area — specifically at $84.46, $85.06, $85.56, $86.51, and $87.03. This concentration forms a formidable overhead barrier that could prove challenging to penetrate on the first attempt.
Should SOL struggle to overcome this resistance cluster, a retreat toward the $81.65 to $78 support region becomes likely. Conversely, a decisive breach above resistance would unlock upside potential toward $87–$88.
Looking at the broader timeframe, technical analyst CryptoCurb has identified a broadening megaphone formation on the weekly chart. This pattern displays multiple confirmations at both the ascending resistance trendline and the descending support boundary throughout various price cycles.
SOL is going to $1,000+ this cycle.#SOLANA ⚡️ pic.twitter.com/fbWP7Oxusg
— curb (@CryptoCurb) April 15, 2026
The pattern’s lower support line continues to provide solid foundation. Maintaining this level keeps the constructive technical outlook alive. CryptoCurb’s upside projection, contingent on breakout confirmation, extends beyond $1,000 — though this represents a potential scenario rather than an established reality.
On-Chain Metrics Reach Unprecedented Levels
Beyond price charts, Solana’s blockchain fundamentals paint an impressive picture. The network processed $1.1 trillion in aggregate economic value during Q1 2026, marking Solana’s inaugural trillion-dollar quarter, based on Artemis analytics.
⚡️@Solana crosses a major milestone as its Total Economic Activity hits $1.1T in Q1 2026, marking the first trillion-dollar quarter for the network. pic.twitter.com/MoGcsCWCXS
— Solana Daily (@solana_daily) April 16, 2026
To put this in perspective, Q3 2025 registered approximately $600 billion while Q4 2025 reached roughly $850 billion. This represents a sequential quarterly increase of nearly 29%.
The network’s active address count currently hovers between 5.5–5.8 million, representing substantial growth from the 3–4 million baseline observed throughout the latter portion of 2025. Address engagement even momentarily peaked between 6.5–7 million during early Q1.
Solana dominated all major blockchain networks in Q1 2026 transaction volume, executing 25.3 billion transactions throughout the three-month period.
On-Chain Transfer Activity Surges
Daily value transfers, which generally fluctuated between $5 and $15 billion during late 2025, recently exploded toward the $70–$75 billion territory.
The PreStocks DEX platform on Solana additionally established a new single-day volume benchmark at $28.65 million.
Despite this robust network activity, SOL’s market valuation hasn’t yet caught up to the underlying blockchain expansion. Value movement is accelerating significantly, but price discovery hasn’t materialized — at least not yet.
SOL’s current technical position shows it challenging the $84 resistance level, while maintaining the $78–$81 support foundation.