
 Price Analysis: Massive Breakout Could Send DOGE to $0.44")
Key Takeaways
- DOGE consolidates around $0.094 within a descending triangle formation established since its 2021 all-time high
- Critical resistance level at $0.10 could unlock upside targets between $0.20 and $0.30
- Elliott Wave framework indicates DOGE may be finishing its final corrective phase around $0.093–$0.094
- Technical expert Javon Marks spots hidden bullish divergence with potential upside to $0.44
- Blockchain metrics reveal 60,000–110,000 daily active addresses, indicating consistent network engagement
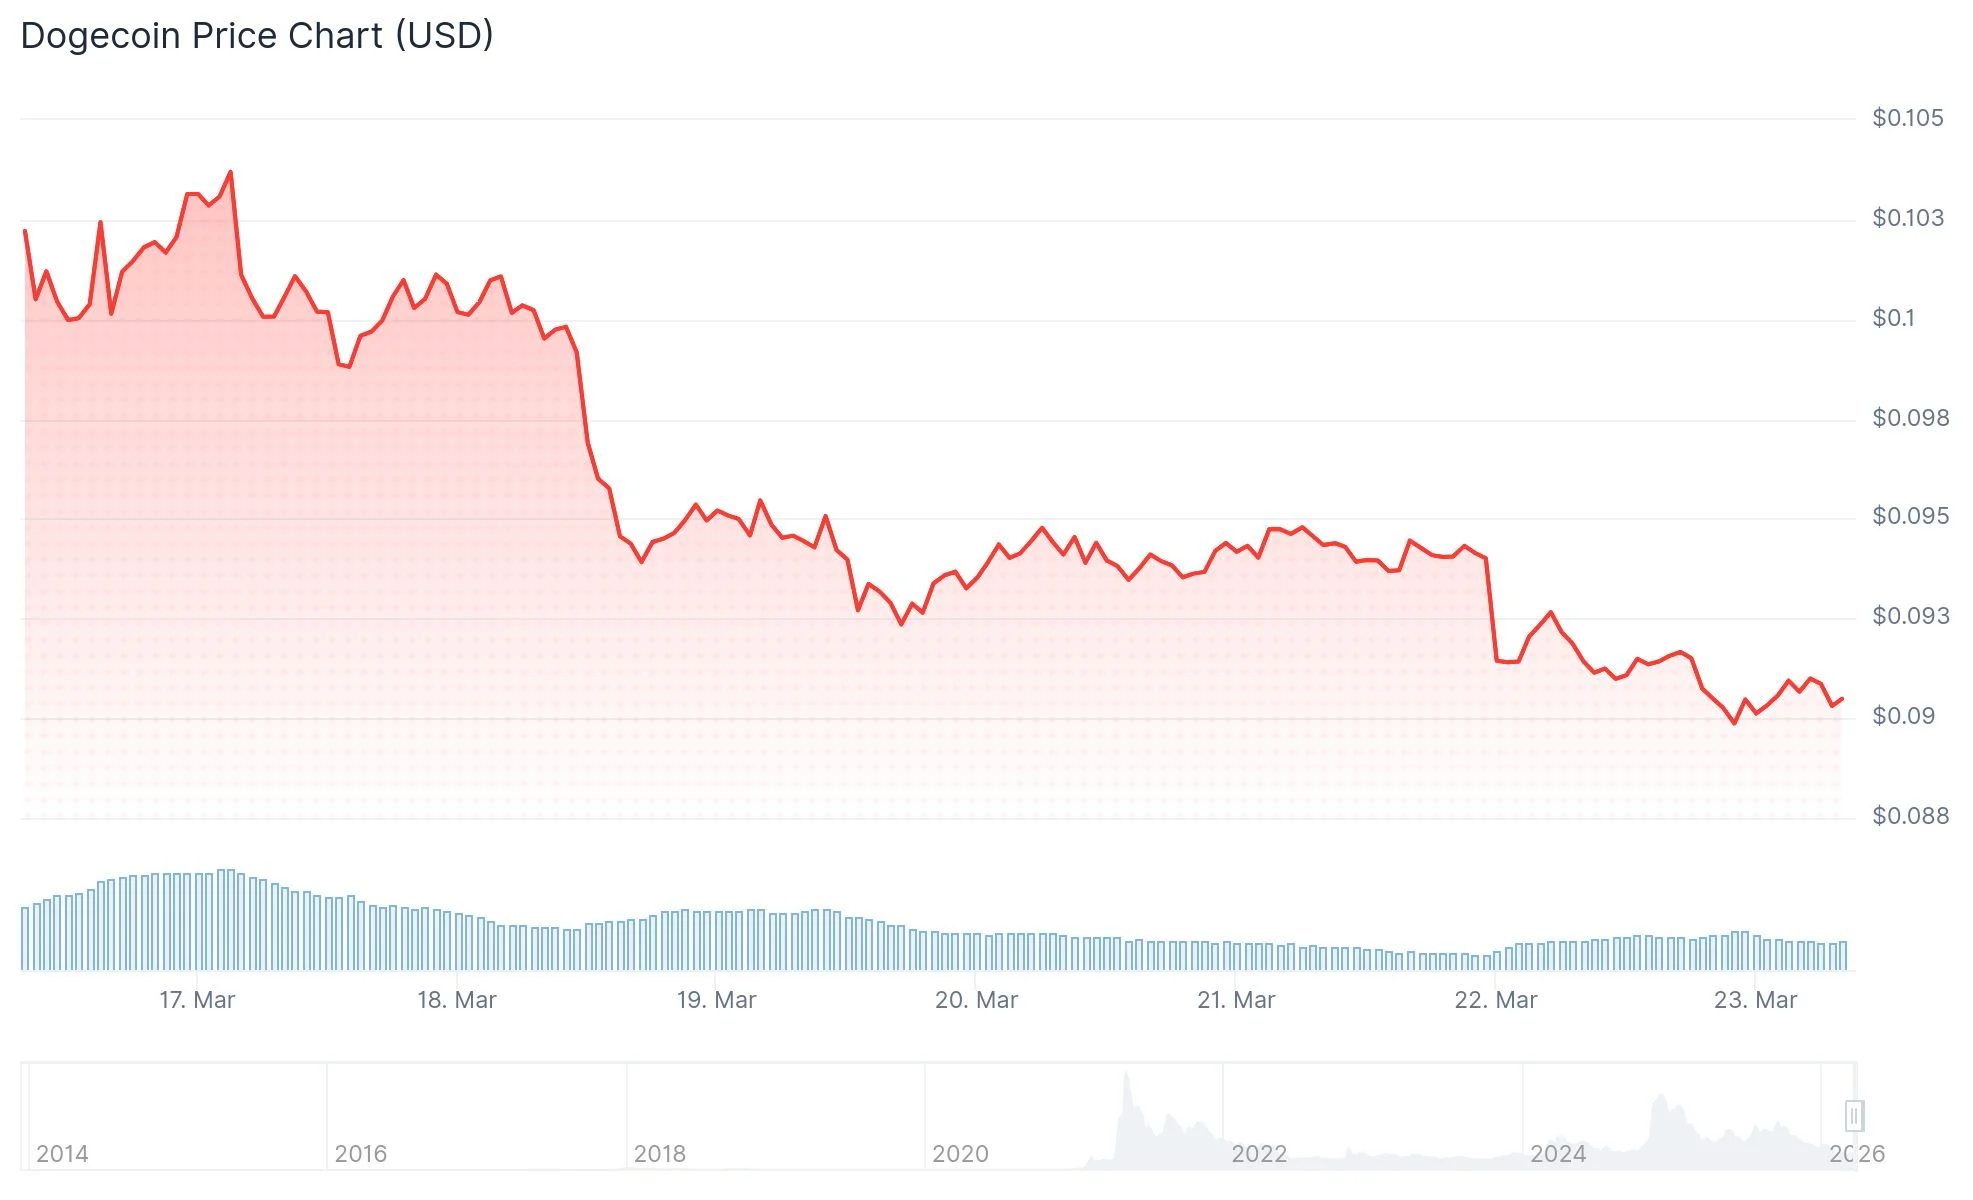
Dogecoin (DOGE) hovers around the $0.094 mark as of March 21–22, 2026, confined within a prolonged technical consolidation structure that market participants are monitoring with keen interest.
Following its peak at $0.73 in May 2021, DOGE has experienced approximately 73% depreciation and entered a lengthy sideways trading range. The weekly timeframe reveals a pattern of descending peaks forming a triangle structure, with the lower boundary maintained in the $0.055–$0.08 corridor.
Chart analyst CryptoPatel drew attention to this configuration, observing that DOGE currently trades near the top edge of this extended squeeze zone. The formation indicates diminishing volatility as downward momentum weakens.
THIS $DOGE Setup Could Create The Next Wave Of Crypto Millionaires
Massive Descending Triangle Forming Since The 2021 Peak.
Price Is Now Sitting At The Accumulation Zone Near $0.08-$0.055… The Tightest Compression In DOGE History.Breakouts From Patterns Like This Have… pic.twitter.com/LPr41NVHVc
— Crypto Patel (@CryptoPatel) March 21, 2026
Market observer Crypto Lens identifies a 5-year accumulation area positioned around $0.07867. Historical breakouts from comparable patterns yielded returns of +173%, +180%, and +421%, although historical performance doesn’t ensure future replication.
Wave Theory Analysis and Momentum Signals
Certain technical strategists interpret the current structure using Elliott Wave principles. According to this perspective, DOGE may be wrapping up the fifth and concluding segment of a corrective downturn, with Fibonacci projection zones landing between $0.093 and $0.094.
Should this corrective wave reach completion around present price levels, buying interest could begin challenging the $0.098–$0.10 resistance band.
With $DOGE's momentum oscillator making lower lows and its price currently holding higher lows, this can be seen as a Hidden Bull Divergence and it could be suggesting here a strong possibility for a huge continuation!
A continuation which can lead prices over +350% above $0.44.… pic.twitter.com/ZfSQQfB22h
— JAVON⚡️MARKS (@JavonTM1) March 21, 2026
In parallel analysis, market technician Javon Marks has detected a hidden bullish divergence developing within the $0.093–$0.095 territory. Price action establishes consecutive higher lows above $0.09, while momentum indicators register lower lows — a configuration typically linked with diminishing downside force.
Marks projects that successful resolution of this divergence pattern could propel DOGE upward by more than 350%, potentially reaching levels beyond $0.44 from the $0.093 base.
Critical Price Zones Under Observation
TradingView technical summaries continue displaying a “Sell” orientation among moving average indicators. Momentum tools such as RSI and Stochastic maintain largely neutral readings.
Market watchers are focusing on these critical zones:
- Resistance barriers: $0.095 and $0.098
- Round number threshold: $0.10
- Support foundations: $0.092 and $0.088–$0.090
A weekly candle closure above the downward-sloping trendline, accompanied by increasing volume, would deliver the most definitive bullish confirmation. Technical projection methodologies suggest a successful breach above $0.10 could establish targets within the $0.20–$0.30 spectrum.
Blockchain analytics from Glassnode and IntoTheBlock indicate daily active addresses fluctuating between 60,000 and 110,000, with transaction counts spanning 80,000 to 200,000 daily.
As of March 22, 2026, DOGE changed hands at $0.09191, reflecting a 2.81% decline during the previous 24-hour period. The $0.09 support threshold remains the critical structural foundation under trader surveillance.