
 Price Analysis: Tight Bollinger Bands Signal Imminent Volatility Spike")
Key Takeaways
- DOGE remains pressured beneath the declining 50-day EMA, struggling below $0.0900
- Futures market data reveals negative funding rates with short positions dominating
- Critical support level identified at $0.0879 — breaking below risks a slide toward $0.0800
- Upside breakout requires clearing $0.0930 resistance to open path toward $0.10; rejection may trigger decline to $0.0835
- Daily chart shows Bollinger Band compression, historically a precursor to significant volatility
Dogecoin currently changes hands around $0.0926, registering a 2.28% gain over the last 24 hours, yet resistance at $0.0930 remains firmly defended by sellers. The popular meme cryptocurrency finds itself trapped between tepid recovery efforts and ongoing downward pressure, forcing market participants to monitor a narrow trading corridor for directional clarity.
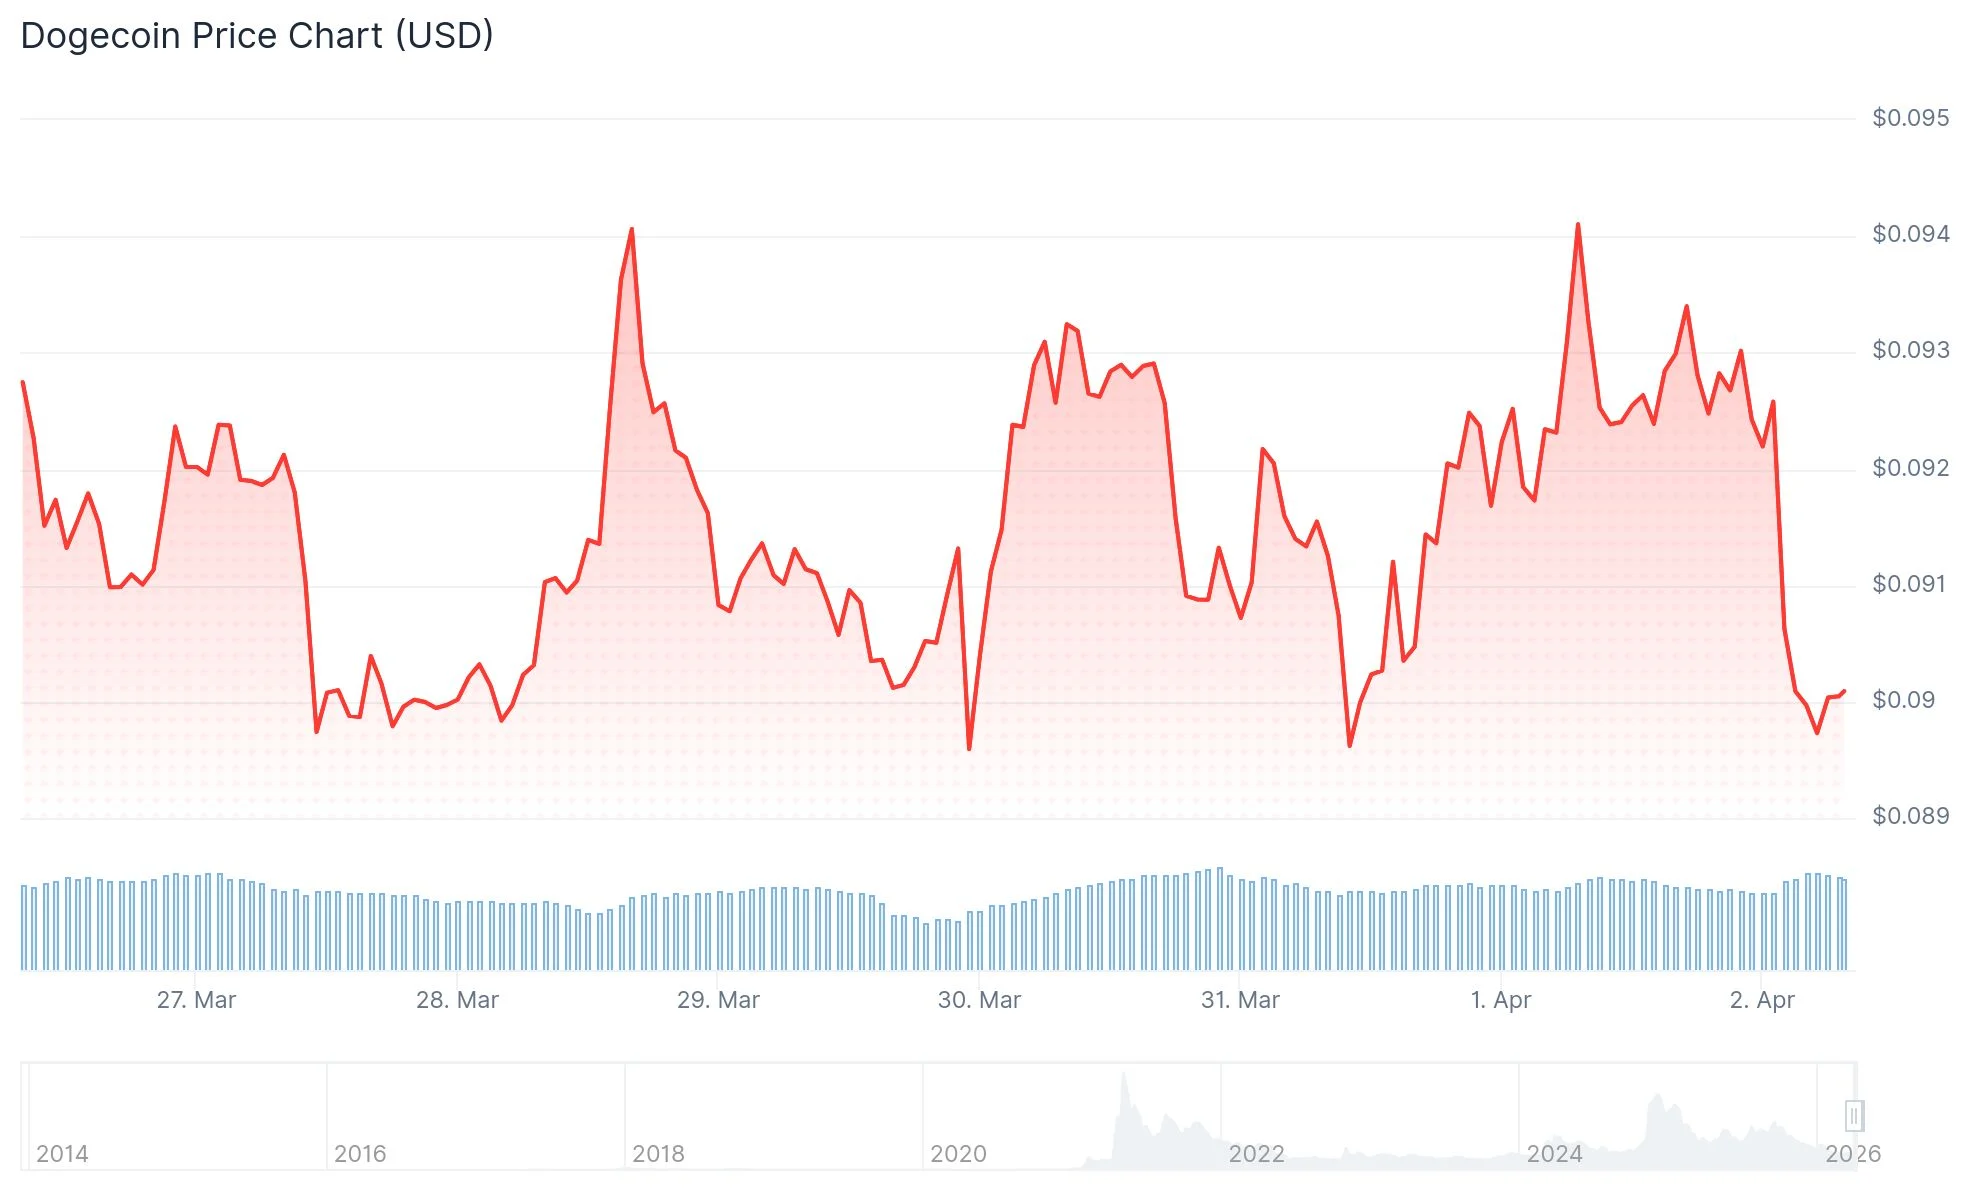
The token touched a session low of $0.0890 before finding buying support. Following this bounce, the price climbed sequentially past $0.0905, $0.0912, and $0.0920. This recovery carried DOGE above the 50% Fibonacci retracement mark calculated from the recent swing high of $0.0937 down to $0.0893.
Hourly chart analysis reveals a developing bearish trend line, establishing resistance around $0.0928. The 76.4% Fibonacci retracement converges at approximately the same zone, creating a reinforced ceiling. Sellers have successfully repelled multiple attempts to breach this barrier.
Price action maintains a position above both $0.0912 and the 100-hour simple moving average. This configuration preserves a tentatively bullish short-term framework, albeit with limited conviction.
Futures Market Indicates Bearish Positioning
The derivatives landscape for Dogecoin reveals bearish trader sentiment. Data from CoinGlass shows DOGE futures Open Interest currently at $1.05 billion, representing a 0.81% decline over 24 hours. Liquidations totaled $4.55 million during this timeframe, with long positions accounting for $3.48 million of forced closures.
The active position long-to-short ratio registers at 0.967, indicating short-side concentration exceeds bullish positioning. The funding rate has turned negative at -0.0097%, confirming that traders are compensating counterparties to maintain bearish positions.
Bollinger Bands are squeezing on Dogecoin $DOGE daily chart, suggesting a major price move could be coming soon. pic.twitter.com/AO6dfMzKkE
— Ali Charts (@alicharts) April 1, 2026
Market analyst Ali Charts highlighted on X that Bollinger Bands are experiencing compression on Dogecoin’s daily timeframe. This technical pattern typically precedes substantial price movements, though the ultimate direction remains uncertain until the breakout occurs.
Critical Price Zones Under Observation
For bullish continuation, DOGE must decisively break through the $0.0928–$0.0930 resistance cluster to establish momentum toward $0.0950, followed by $0.0980. Successfully clearing $0.0980 would bring the psychologically significant $0.10 level into realistic range, with $0.1020 representing the subsequent target.
$DOGE is gathering energy at the bottom of the rising channel.
It is still located at the starting line, and a rally will begin soon. pic.twitter.com/gCoo4yLn7T
— CW (@CW8900) April 1, 2026
The 50-day and 100-day exponential moving averages position themselves at $0.0974 and $0.1107 respectively, functioning as meaningful overhead resistance barriers.
Regarding downside risk, $0.0915 represents the initial support layer. Beneath that level, $0.0900 serves as a psychologically important floor. A confirmed daily close underneath $0.0879, which marks the February 11 low, could accelerate DOGE downward toward $0.0800 and possibly extend to $0.0741.
The Relative Strength Index on the hourly timeframe maintains readings above 50, while the MACD indicator continues showing bullish signals despite weakening momentum. On the daily chart, RSI positions near 43, residing below the neutral threshold and reflecting modest bearish undertones.
Current market structure shows DOGE sustaining levels above near-term support at $0.0912, while the $0.0930 resistance zone persists as the primary obstacle bulls must overcome in the immediate trading sessions ahead.