
 Whales Accumulate 500M Coins as Bollinger Bands Tighten for Potential Breakout")
Key Takeaways
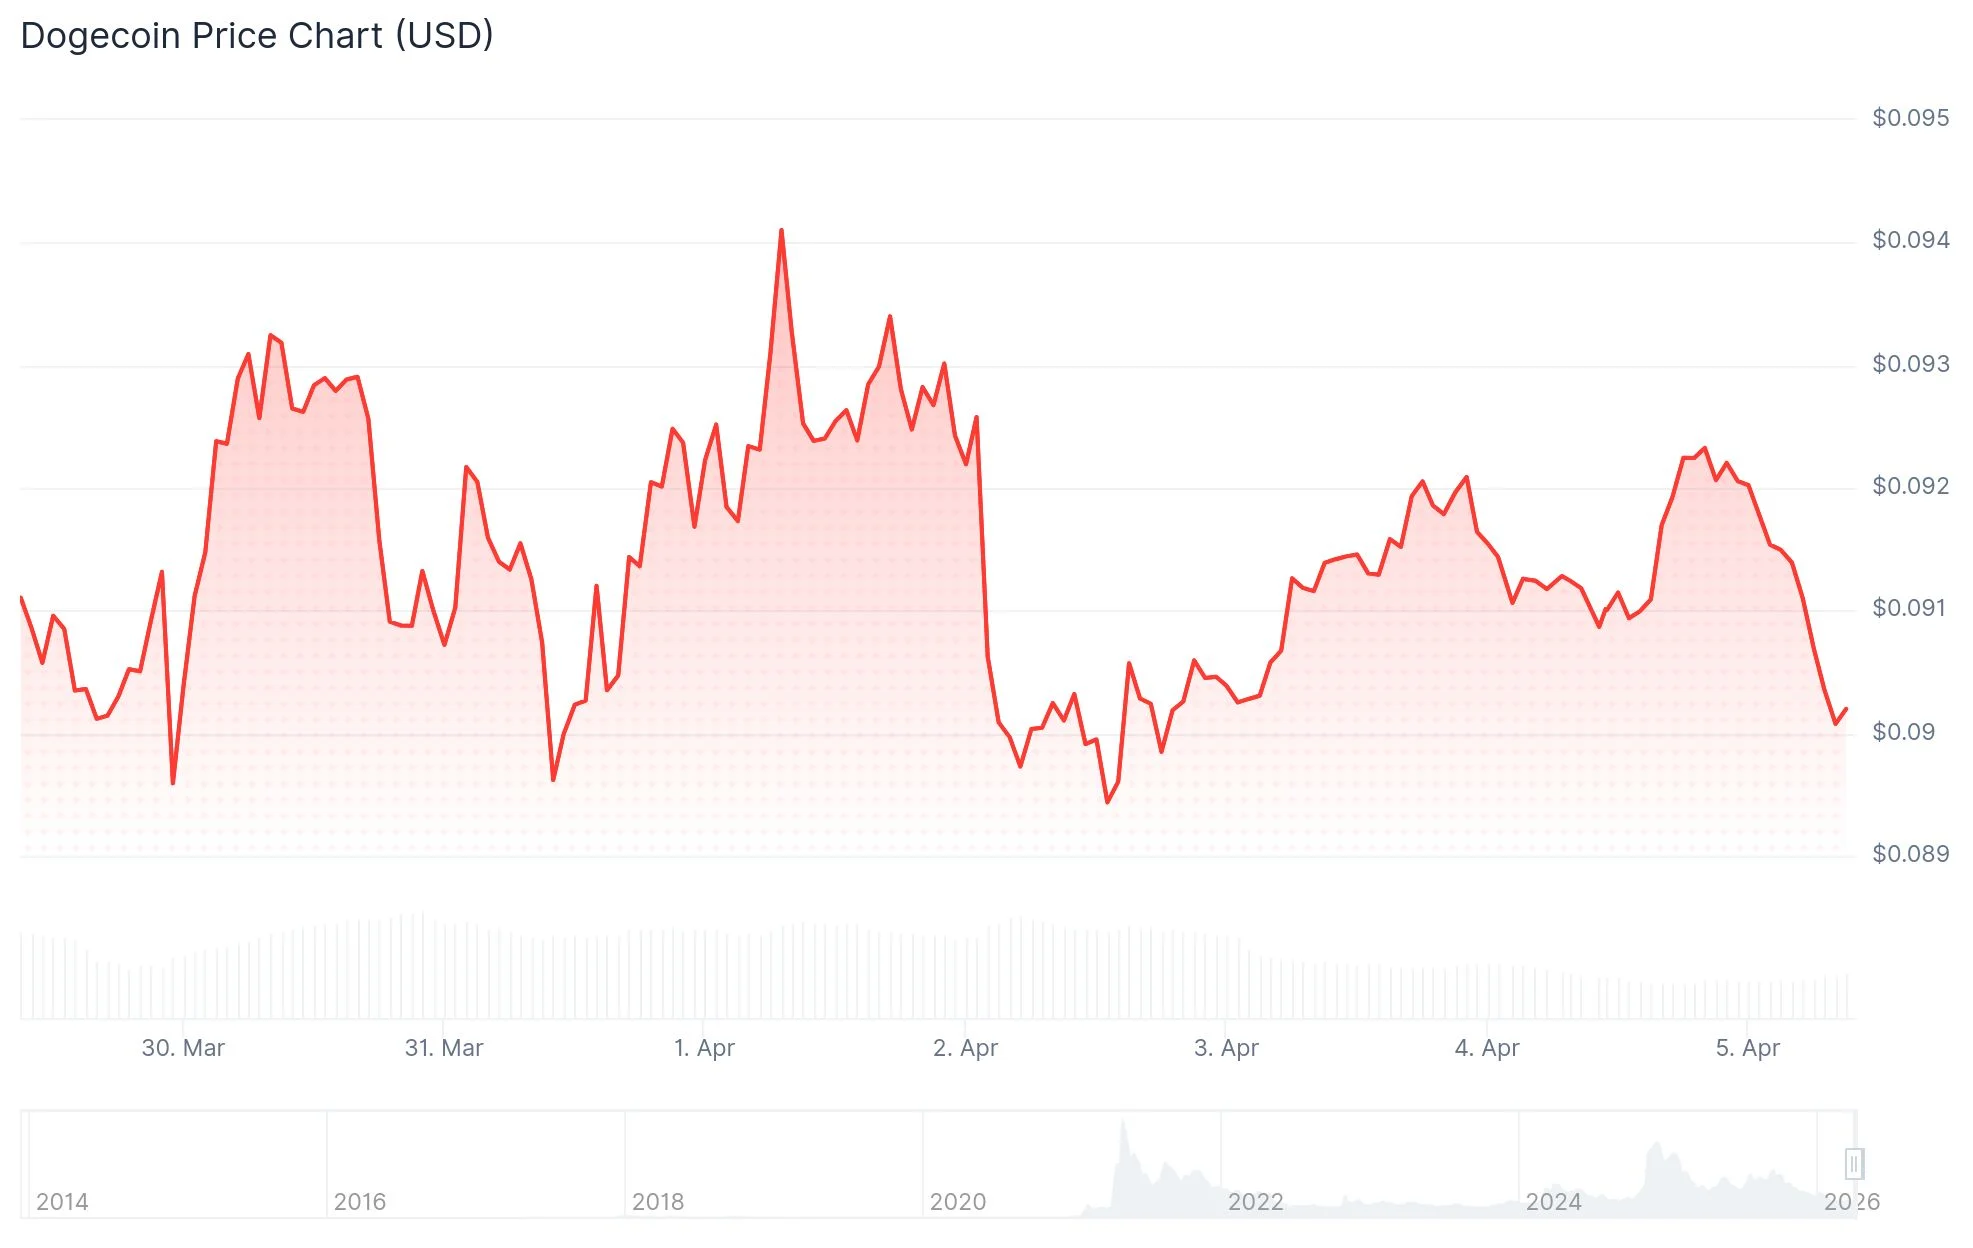
- DOGE currently hovers near $0.091, experiencing a decline exceeding 5.5% across the last month, with 24-hour trading volume contracting approximately 25% to $530–$543 million.
- Technical analysis reveals a Bollinger Band compression pattern on the daily timeframe, a configuration that typically precedes significant price volatility.
- Large-scale investors have discreetly purchased more than 500 million DOGE tokens beginning March 31, 2026, throughout the ongoing consolidation phase.
- Breaking above $0.095 on a daily close could catalyze a 26% rally, whereas falling beneath $0.08821 may push prices toward $0.055.
- Derivative market data shows bullish positioning dominates, with long liquidation exposure at $11.61 million compared to $9.21 million in short positions at critical thresholds.
Dogecoin continues to trade within a narrow corridor, hovering around the $0.091 mark following several weeks of indecisive market behavior. The popular meme cryptocurrency has shed over 5.5% throughout the past month, accompanied by a roughly 25% contraction in trading activity, which now registers between $530 and $543 million across a 24-hour window. This volume decline points to reduced trader engagement and market uncertainty.
Yet amid this sluggish price movement, a notable development emerges: significant accumulation by major holders.
Starting from March 31, 2026, cryptocurrency whales have strategically amassed upwards of 500 million DOGE tokens. This accumulation phase coincided with price oscillation between $0.087 and $0.101, a channel that has constrained the asset for more than seven days. The strategic purchasing activity by these heavyweight investors during consolidation has attracted considerable analytical attention.
[[SCRIPT_0]]
A market analyst highlighted this accumulation pattern via social media platform X, noting its convergence with a textbook Bollinger Band Squeeze formation visible on daily charts. Historically speaking, this technical setup — characterized by volatility compression into narrow bands — frequently serves as a precursor to substantial directional price movements.
Critical Support and Resistance Zones
Chart analysis reveals DOGE developing what appears to be a descending triangle configuration on the daily timeframe. This pattern’s narrowing structure suggests an imminent directional breakout may materialize in the near term.
The bullish scenario presents compelling targets: should DOGE achieve a daily candlestick closure above the $0.095 threshold, technical analysts project a potential 26% price appreciation. Such a move would position the cryptocurrency near $0.119. Bollinger Band projections similarly indicate a possible advance toward $0.108972 given sufficient buying momentum.
[[SCRIPT_1]]
Conversely, downside vulnerability exists. A breakdown below the $0.08821 support level would expose the next substantial floor located considerably lower around $0.055.
The Average Directional Index (ADX) currently registers 13.69, significantly beneath the critical 25 benchmark. This reading confirms weak trending conditions and indicates the market lacks clear directional conviction at present.
Futures Market Positioning and Market Sentiment
Within the derivatives landscape, bullish traders maintain a marginal advantage. CoinGlass analytics reveal $11.61 million concentrated in long positions against $9.21 million in short exposure, with these positions clustering near key liquidation zones at $0.0895 and $0.0932. Open Interest has experienced a modest 0.75% reduction, suggesting moderately diminished speculative engagement.
Certain market participants are monitoring April’s performance with heightened attention. Historical data indicates April has proven favorable for DOGE. During April 2021, the meme token exploded 531% throughout the month, ultimately climbing to $0.453. While historical patterns provide no guarantee of future outcomes, this precedent remains on traders’ radar.
As of current market conditions, DOGE exchanges hands at $0.091 amid subdued volume and compressed volatility metrics. The next meaningful directional move will likely hinge on whether a daily candle successfully closes above the $0.095 resistance level.