
 Maintains Critical Support at $88 While RWA Sector Surges Past $1.8 Billion")
Key Takeaways
- Solana maintains its position near $88, defending critical trendline support following a retreat from $95
- Market sentiment shifted to Fear (30) on the Fear and Greed Index after Fed Chair Powell addressed economic uncertainty from Iran conflict
- The network handled more than 880 million transactions in the past week, though weekly fees stayed modest at $4.6 million
- Real-world asset tokenization on Solana has eclipsed $1.82 billion, while RWA DeFi total value locked reached $465 million
- Technical observers identify $50–$80 as a strategic accumulation window, projecting potential targets ranging from $500 to $1,000
Solana continues to defend the $88 price zone following its decline from $95 earlier this month. The cryptocurrency is currently resting on a critical trendline support that market participants are monitoring closely for directional signals.
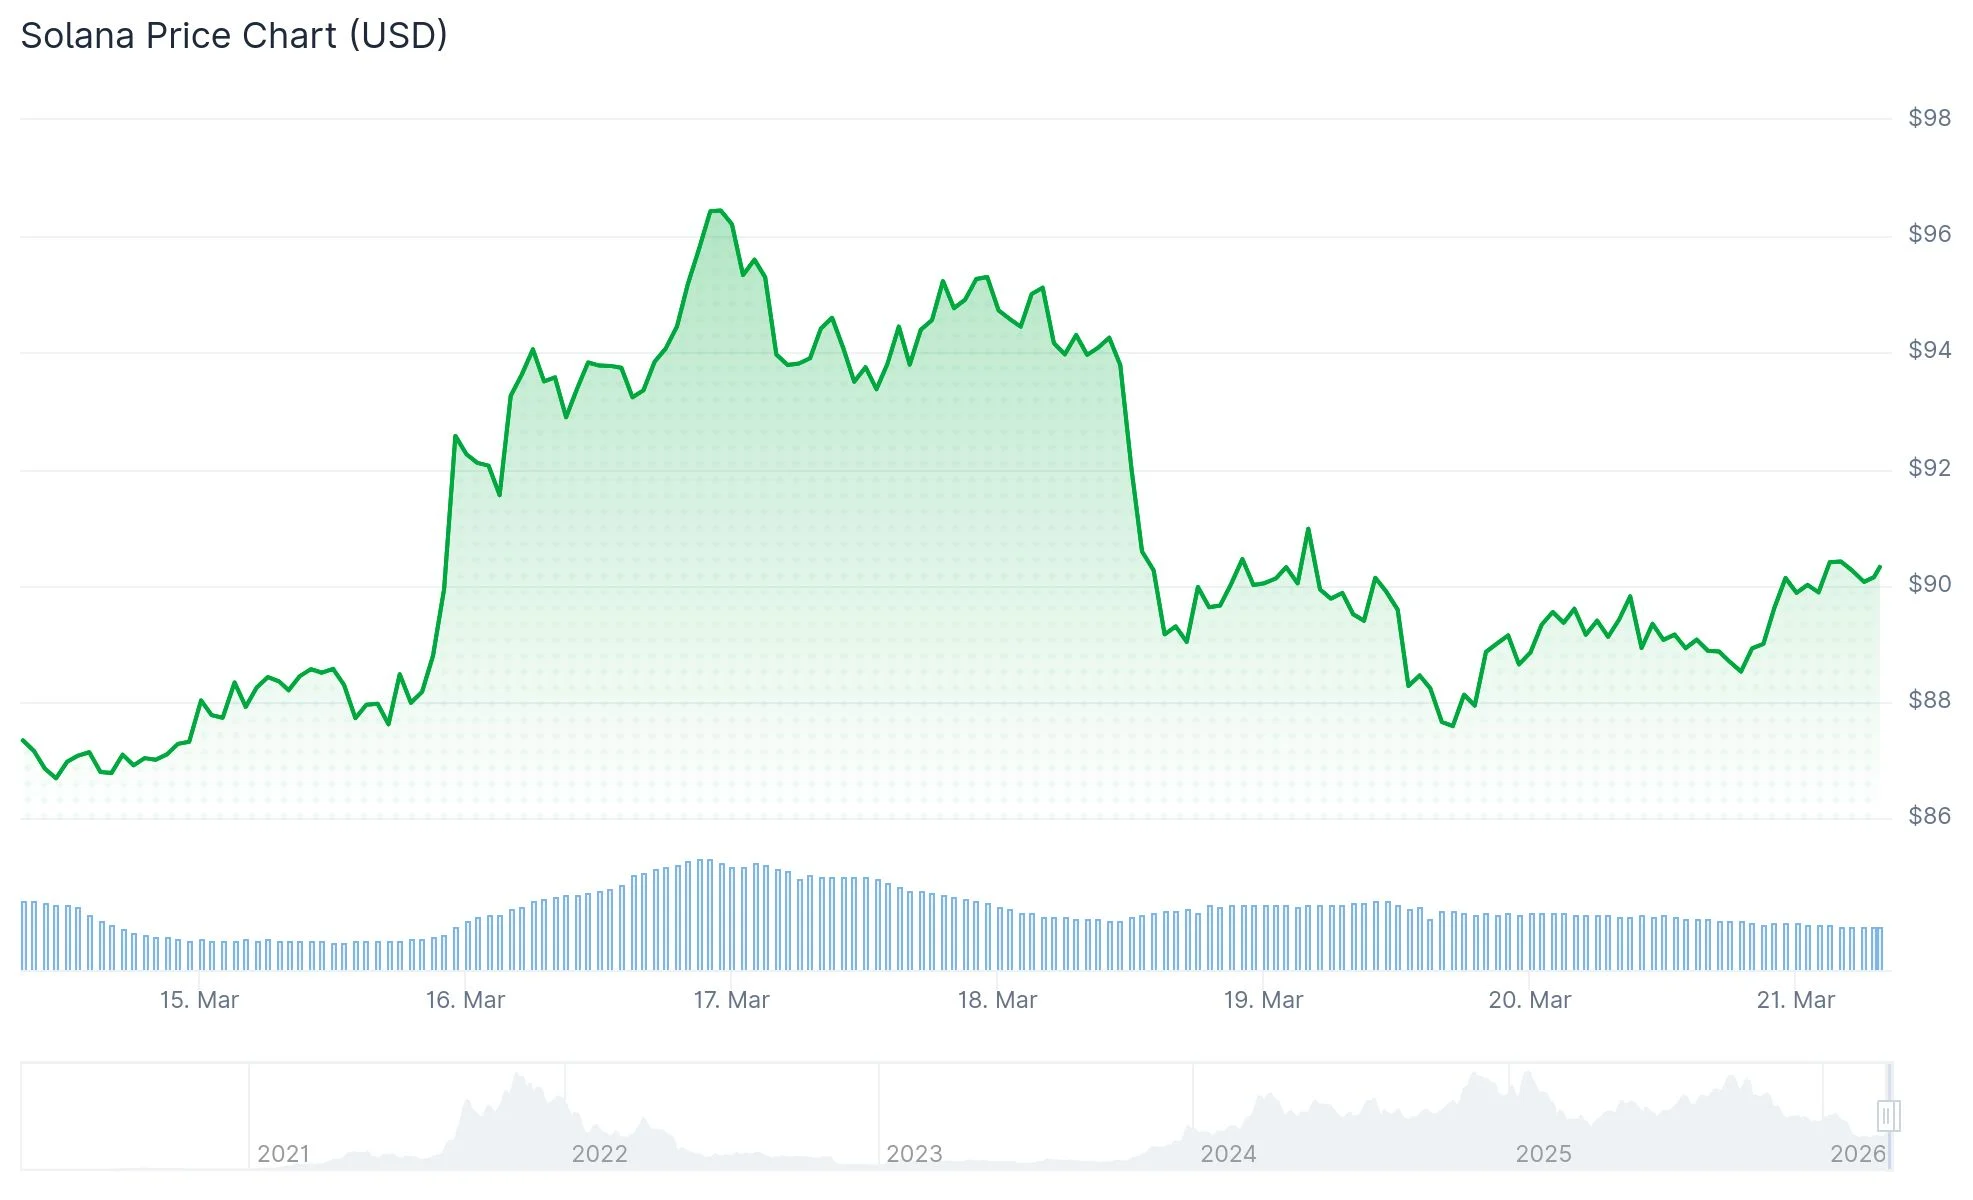
Daily trading volume has contracted to $3.3 billion, a significant decrease from the $6.5 billion recorded on March 16 when SOL momentarily reached $95. Market participants appear to be securing profits during upward price movements as overall cryptocurrency sentiment becomes more risk-averse.
The Crypto Fear and Greed Index retreated from 46 (Neutral territory) to 30 (Fear zone) following Federal Reserve Chairman Jerome Powell’s remarks indicating the economic consequences of the Iran conflict remain “uncertain.” Rising oil prices could trigger inflationary pressure, potentially postponing or eliminating anticipated Fed interest rate reductions this year.
Transaction Volume Versus Fee Generation
The Solana network facilitated over 880 million transactions during the previous week. This figure approaches the all-time peak of 959 million transactions recorded in the week concluding February 8.
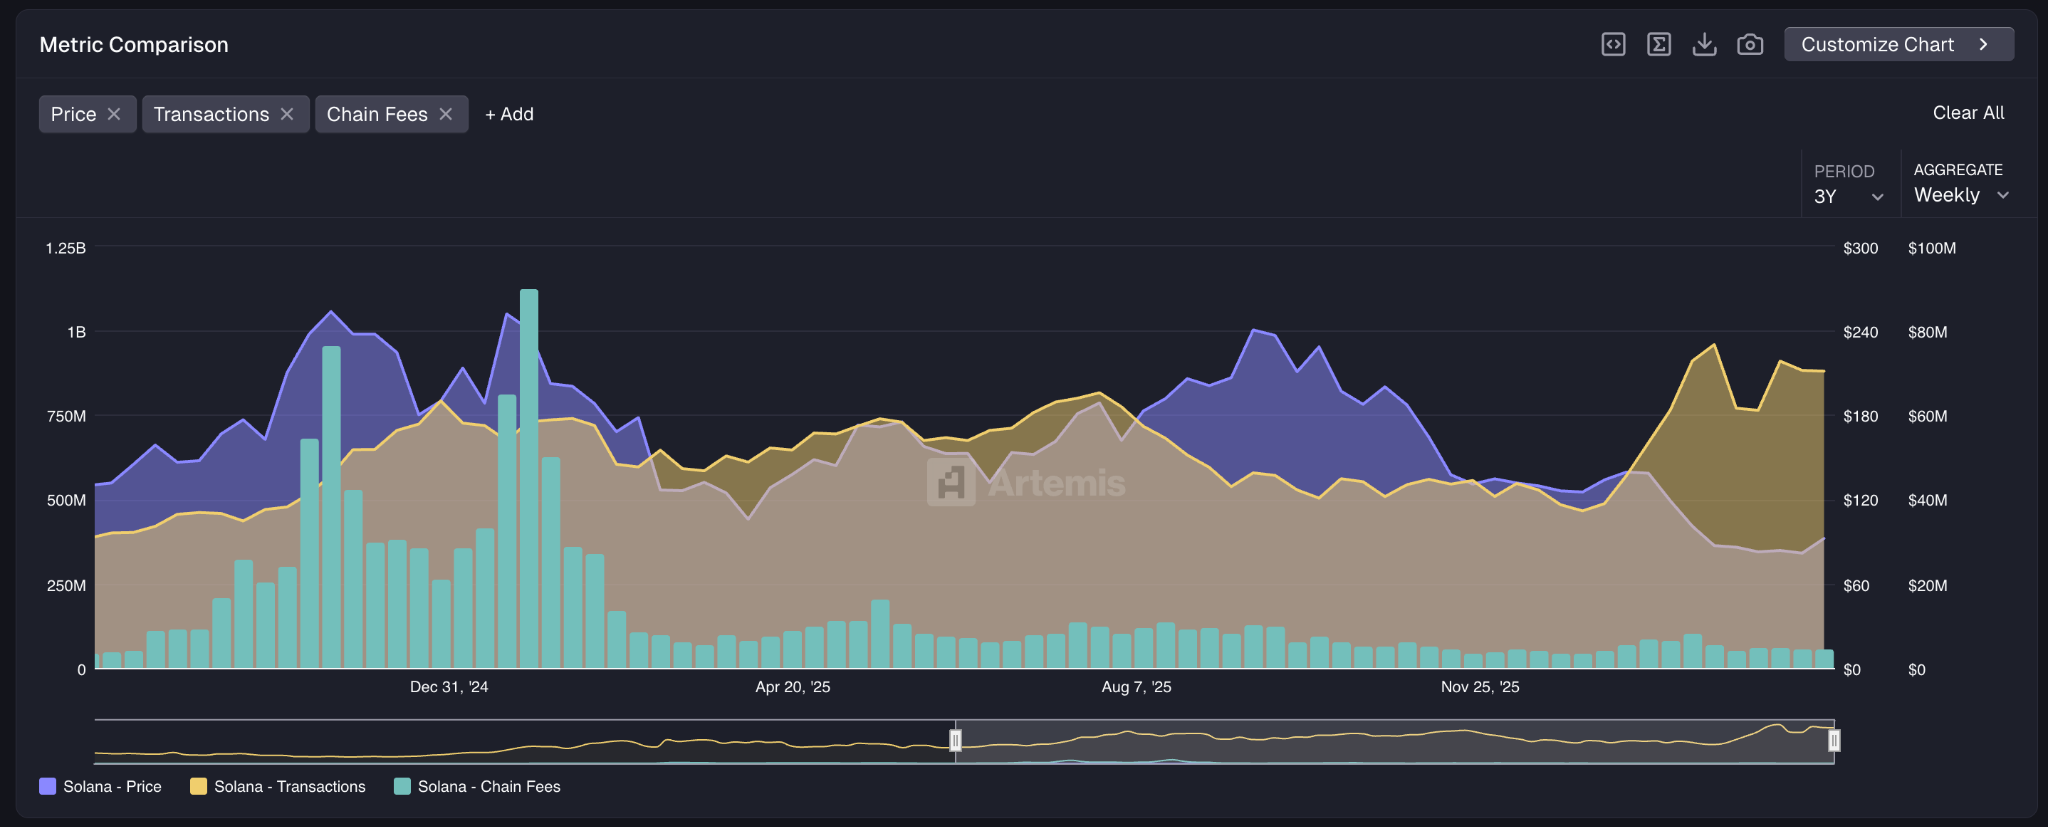
Despite this robust network usage, weekly fee collection totaled merely $4.6 million. This represents a 50% reduction compared to Solana’s fee generation during its June–September 2025 price surge, even though transaction volumes during that period were comparatively lower at 700–800 million weekly.
Reduced fee generation typically indicates lower network valuation metrics. Market observers interpret the current disconnect between transaction activity and fee income as a potentially bearish indicator for the medium-term outlook.
From a technical perspective, SOL confronts significant resistance at the $87 threshold. A breakdown beneath this support could push the token toward $77, representing an 11.5% downside move. Conversely, if this level holds firm and substantial volume emerges during U.S. market hours, it could facilitate a recovery toward the $100 benchmark.
Real-World Asset Platform Reaches $1.82 Billion Milestone
Solana’s real-world asset infrastructure surpassed $1.82 billion in tokenized assets on March 20. This encompasses tokenized debt instruments, equity securities, and investment funds migrated onto the blockchain.
RWA-focused DeFi applications on Solana achieved an unprecedented $465 million in total value locked. Although Solana ranks behind Ethereum in aggregate RWA market capitalization, it continues expanding its footprint in this emerging sector.
$SOL Under $80 is a Gift That Appears Once Every 4 Years. We Are Here
Most people panicked and sold.
But the monthly chart tells a different story:
✅ Breakout
✅ Retest
✅ Support holding
✅ Fib levels perfectly alignedAccumulation Zone: $80-$50
Targets: $500 – $1,000The… pic.twitter.com/usPITk7kdf
— Crypto Patel (@CryptoPatel) March 20, 2026
Cryptocurrency analyst Crypto Patel shared on X that the monthly price chart displays a validated breakout pattern, successful support retest, and robust support maintenance. Patel emphasized that Fibonacci retracement zones remain intact and characterized the $50–$80 range as an exceptional accumulation opportunity. Drawing from historical cycle analysis, Patel projected SOL could achieve $500–$1,000 valuations if prior market patterns materialize.
SOL currently trades near $88, with the $87 support threshold serving as the pivotal reference point for short-term price direction.