
 Rebounds at $80 Support, But Analysts Warn of Further Downside Risk")
Key Takeaways
- Solana registered a 3% price increase over 24 hours following a test of the $80 support threshold
- Daily trading volume jumped nearly 90%, reaching $3.7 billion
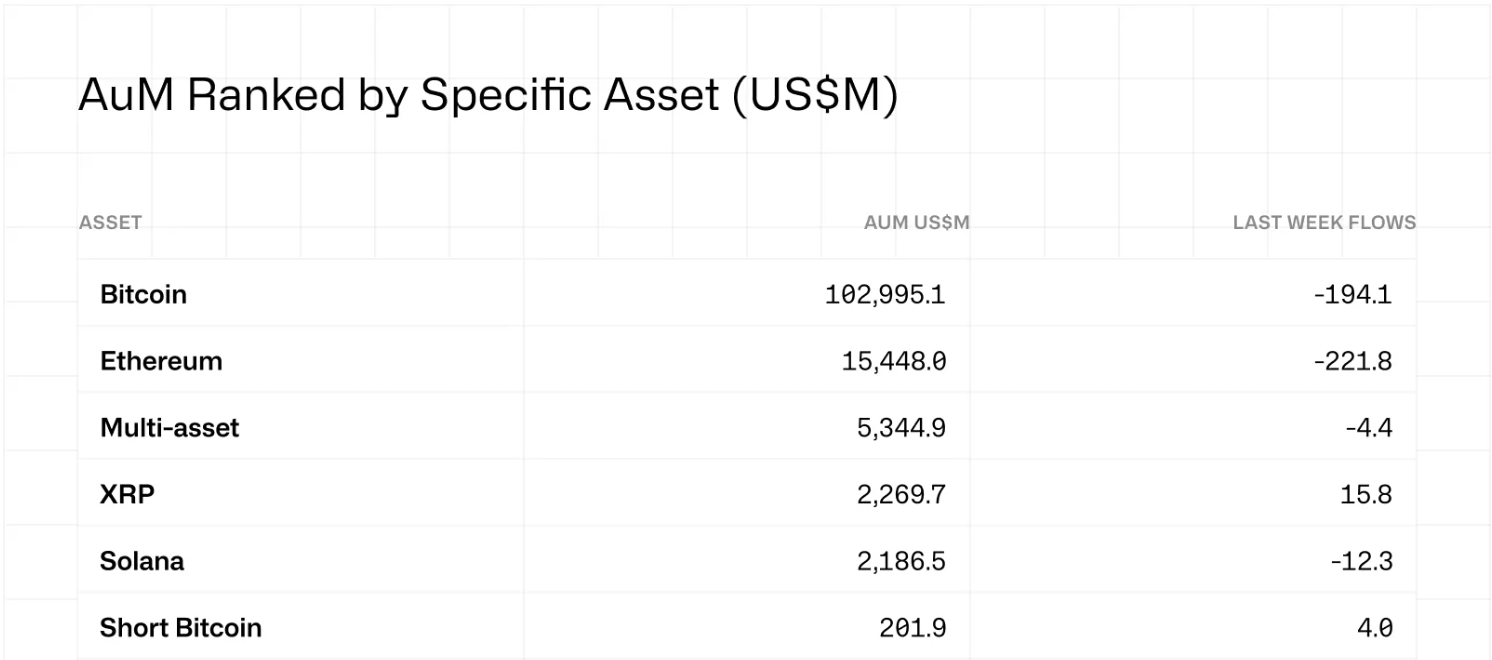
- Digital asset ETFs experienced $414 million in withdrawals, marking their first weekly decline in five weeks
- Critical resistance zone identified at $84–$85; failure to hold $78 could trigger a decline to $67
- Market observers identify the $70–$80 range as a potential long-term accumulation opportunity
Solana currently hovers around $82 following a rebound from the $80 support threshold. The modest 3% uptick over the last day interrupted a four-day decline, though market experts remain cautious about declaring a complete turnaround.
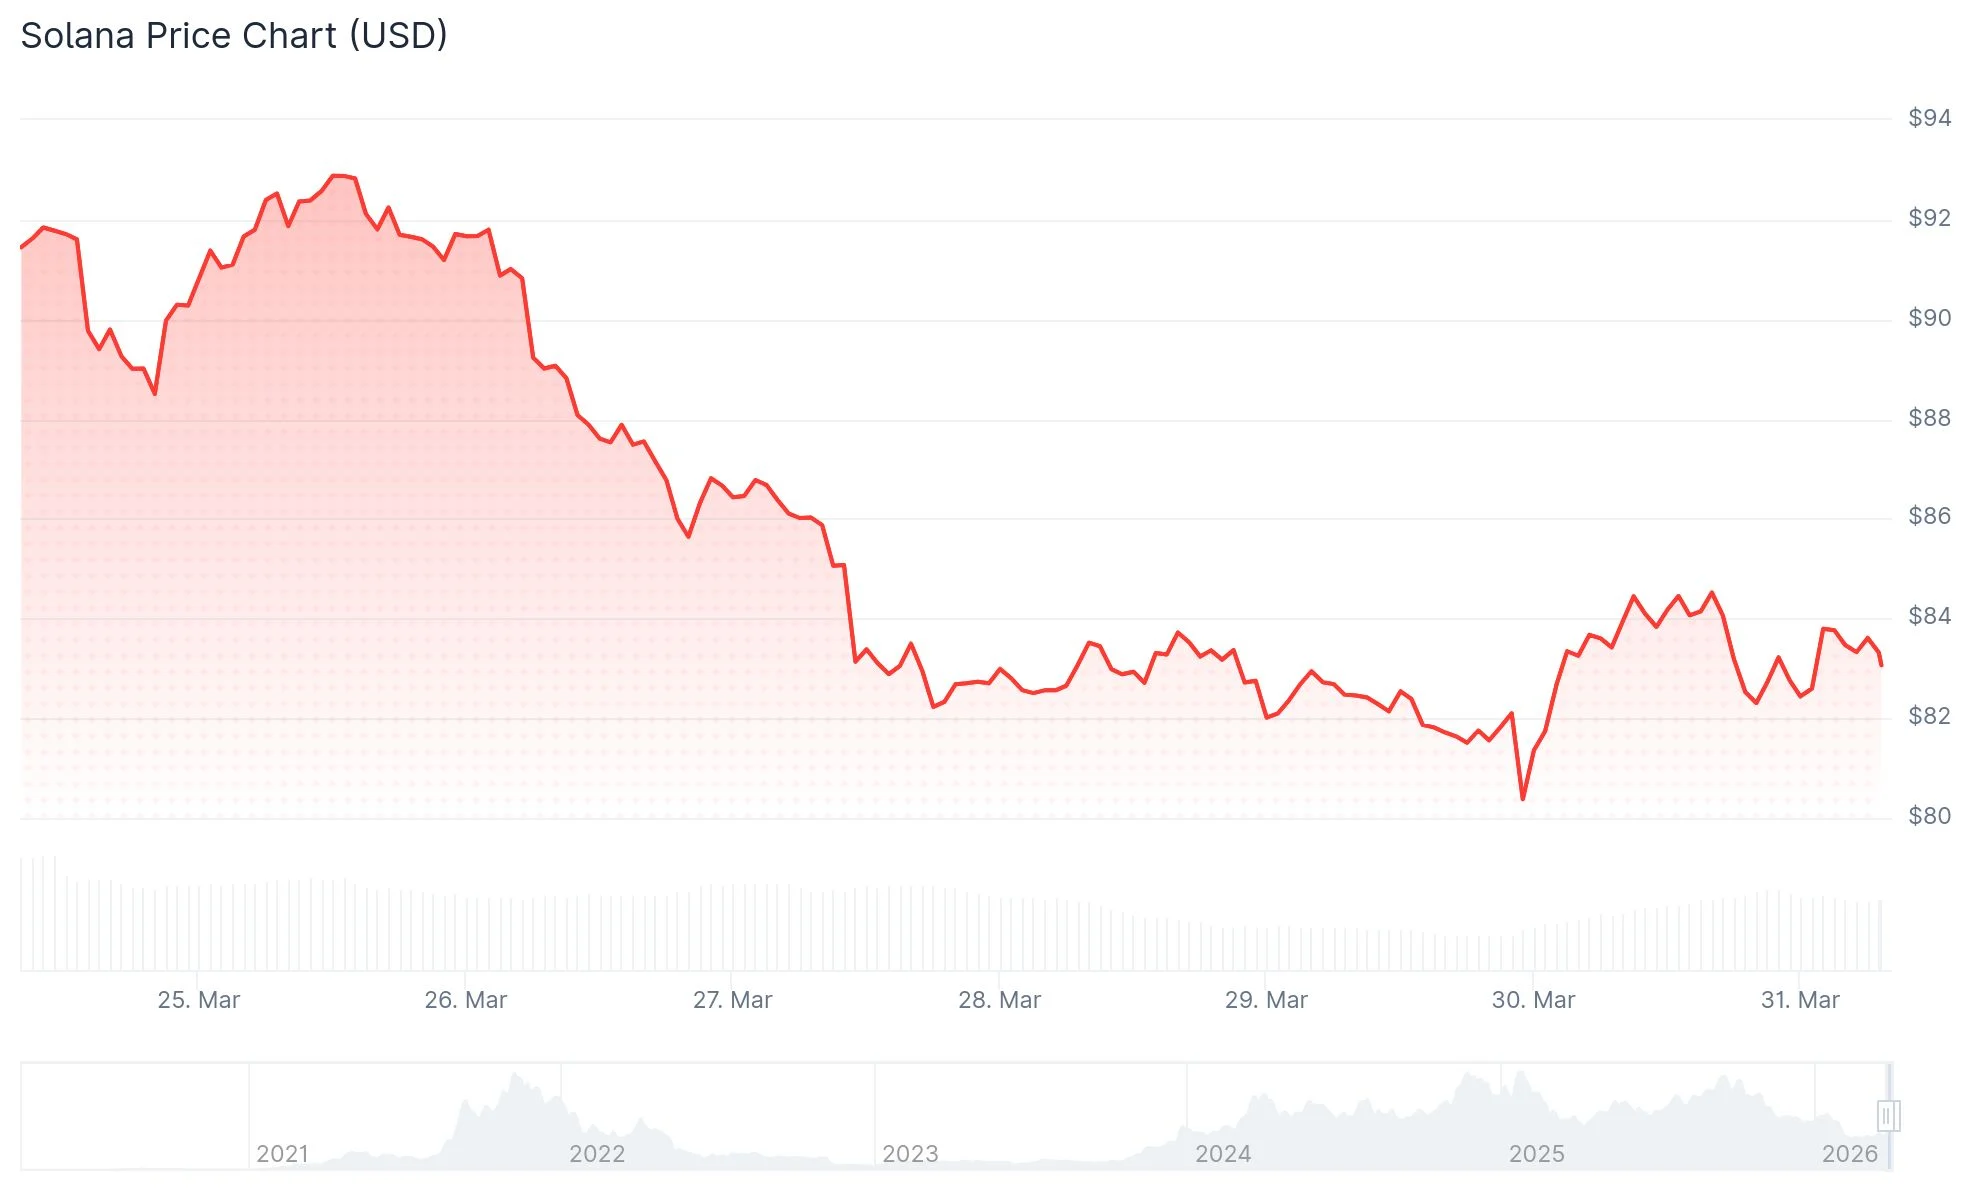
During this timeframe, trading activity climbed approximately 90%, hitting $3.7 billion in volume. This figure represents roughly 8% of SOL’s entire circulating market capitalization.
The recovery at the $80 level appears to be a technical response to psychological support at this round number. While institutional orders may have been positioned here, this development doesn’t necessarily signal a complete trend reversal.
A genuine recovery would require SOL to push back above the $90 threshold. Such a move would indicate a successful breakout from the present consolidation pattern.
The Relative Strength Index has declined beneath 40 and crossed below its 14-day moving average. This technical setup suggests strengthening bearish pressure in the near term.
Critical Price Zones Under Market Surveillance
The $84–$85 range represents the initial resistance barrier that SOL must overcome. This area functioned as support before the recent breakdown, making its recapture an important bullish signal.
Should buyers maintain control above this territory, market watchers anticipate a possible advance toward $88 and subsequently $92. Conversely, losing the $82 level could prompt a reexamination of the $78 demand zone.
A breakdown beneath $78 presents the most significant downside threat. Market analysts indicate that such a move could push Solana down to $67, matching the February 6 bottom—representing approximately a 20% decline from present levels.
This scenario continues to play out for Solana $SOL, with $74.11 and $50.18 in focus. https://t.co/susmj05GT7 pic.twitter.com/R9W73NmKHs
— Ali Charts (@alicharts) March 30, 2026
Market analyst Ali Charts shared on X that downside targets of $74.11 and $50.18 remain active considerations for SOL should the prevailing bearish conditions persist.
Broader Market Dynamics Intensifying Downward Pressure
Digital asset ETFs registered $414 million in net withdrawals during the previous week, breaking a four-week positive inflow trend. CoinShares analyst James Butterfill attributed this shift to market anxiety surrounding the Iran situation and mounting inflation concerns.
Crude oil valuations have climbed back above $100 following a temporary dip below $90. The ongoing closure of the Strait of Hormuz continues to support elevated energy prices.
Escalating energy expenses amplify inflation worries, potentially compelling the Federal Reserve to maintain elevated interest rates for an extended period. Such conditions typically create headwinds for risk-sensitive assets including cryptocurrencies.
The Crypto Fear and Greed Index plummeted from 46 (Neutral) to 27 (Fear), mirroring the prevailing cautious sentiment across the market.
Solana Treasury companies continue to dump towards new lows.
No buying demand is coming for $SOL, and this is really bad.
It seems like $50 SOL will happen in 2026. pic.twitter.com/6XFcs8SxcL
— Ted (@TedPillows) March 29, 2026
Analyst Ted Pillows noted on X that Solana treasury entities continue distributing tokens, with minimal observable buying interest. He projected that SOL could reach $50 by 2026.
At the time of writing, SOL is valued at $82.30 with weekly losses hovering near 10%.