
 Price Eyes $1.40 Breakout as Bulls Challenge Critical Resistance")
Key Highlights
- XRP surged past a descending trend line on the hourly timeframe, signaling renewed bullish momentum.
- The token peaked at $1.3963 before experiencing minor profit-taking, maintaining ground above the 100-hour SMA.
- Key resistance zone between $1.3880 and $1.40 remains the focal point for bulls.
- Critical support levels are positioned around $1.3575 and $1.3330.
- Market developments included positive ETF flows and regulatory updates, though technical indicators show conflicting signals.
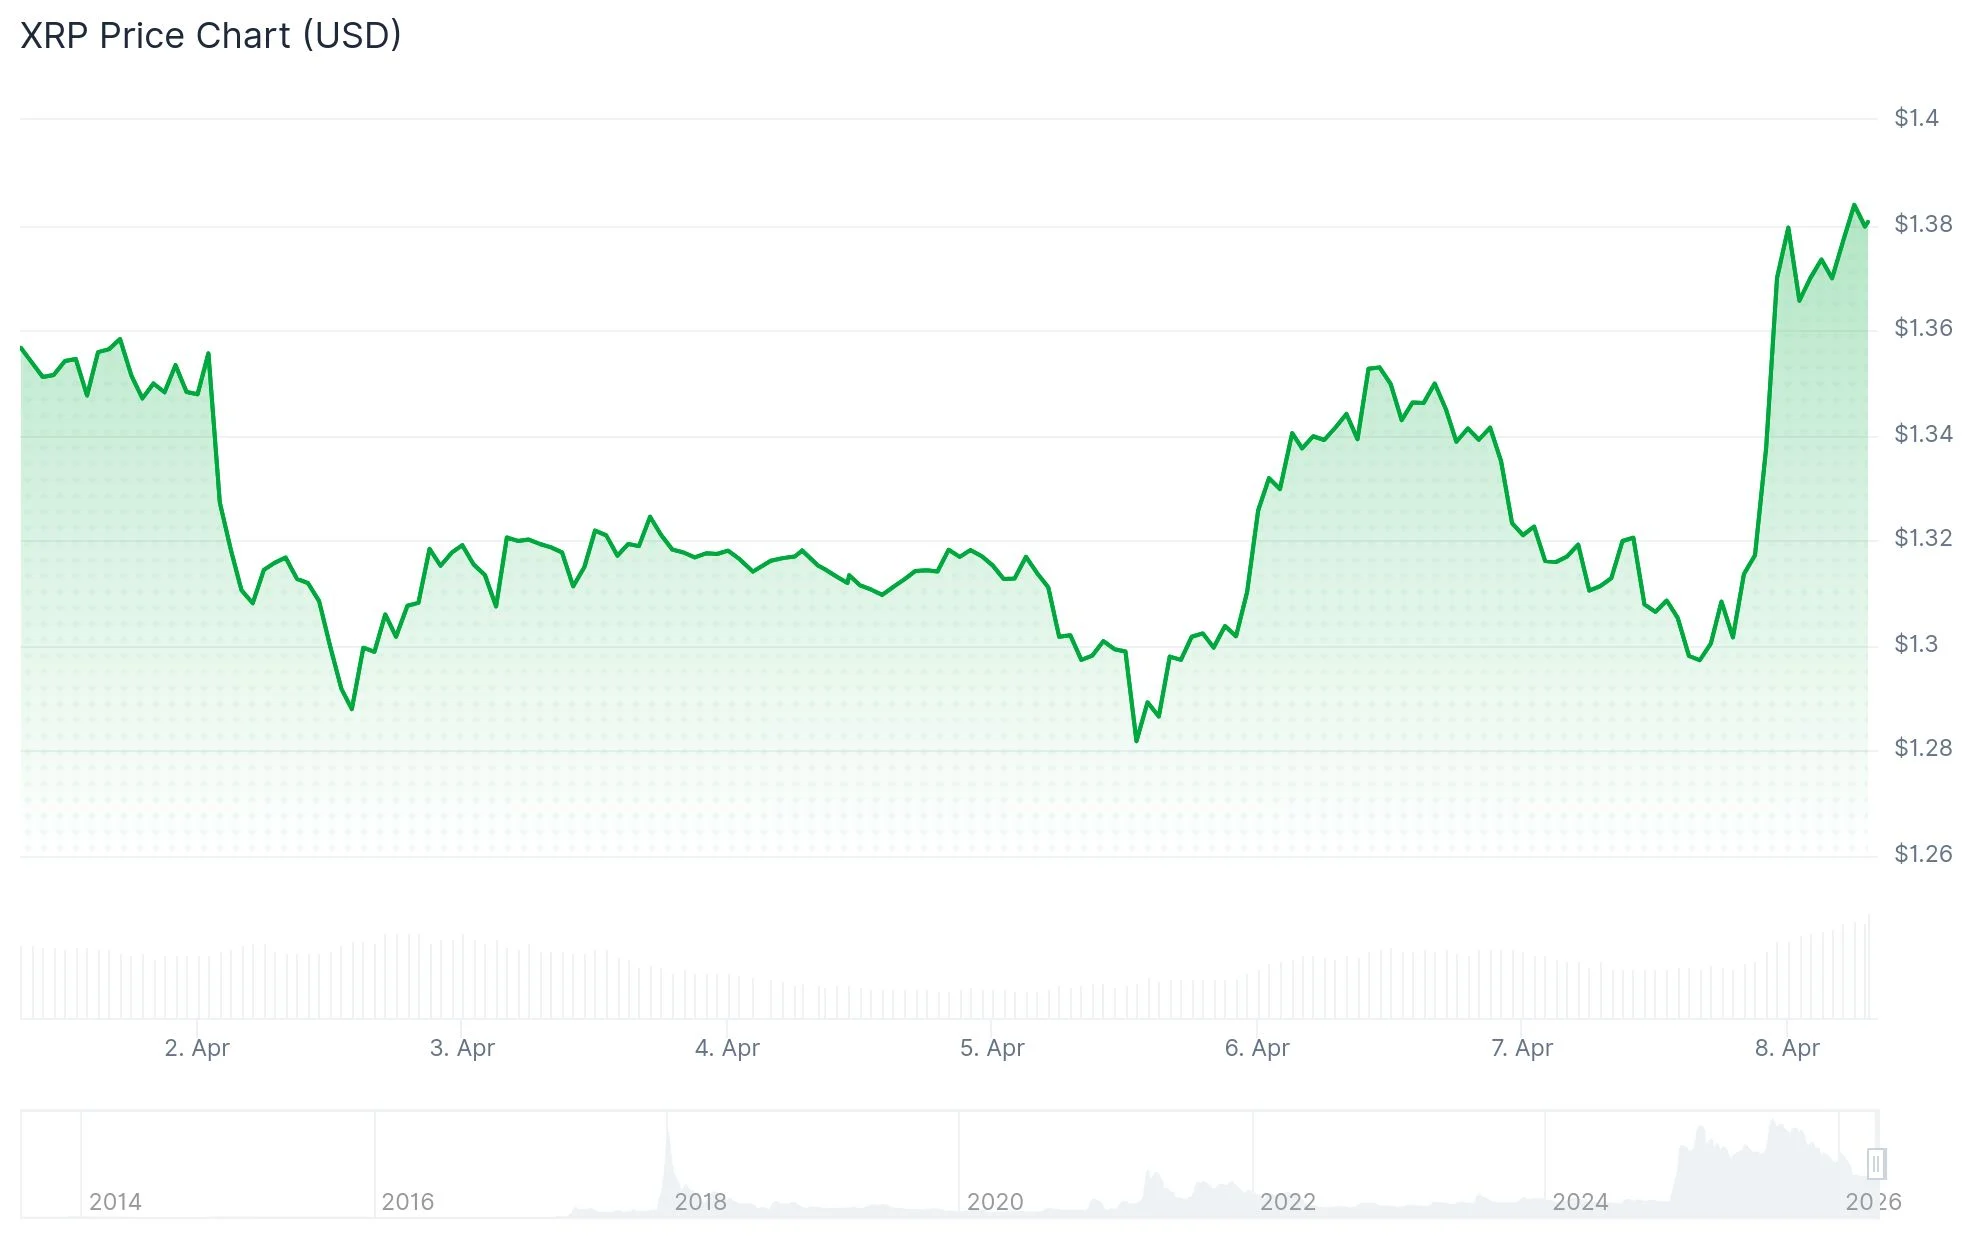
XRP (XRP) experienced notable upward momentum during today’s trading session, advancing toward the psychologically important $1.40 threshold. Following a session peak of $1.3963, the digital asset consolidated around the $1.38 mark.
The upward trajectory gained traction after XRP successfully breached the $1.350 and $1.3550 price levels. Market participants then drove the asset beyond the $1.3650 barrier.
Technical analysis of the hourly chart reveals that XRP penetrated a descending trend line that had established resistance around $1.3350. This technical breakthrough provided additional fuel for the current rally.
📈 ONLY XRP IS ATTRACTING MONEY RIGHT NOW
BTC, ETH, and SOL spot ETFs all saw outflows, losing $159M, $64.7M, and $15.4M, respectively.
XRP stood alone with a $3.32M net inflow. pic.twitter.com/ofnzmKD74p
— Coin Bureau (@coinbureau) April 8, 2026
Following its advance to $1.3963, XRP encountered minor selling pressure. Nevertheless, the cryptocurrency maintained its position above $1.3550 and continues trading above the 100-hour simple moving average.
Market attention has shifted to the upcoming resistance barrier. Observers are monitoring whether XRP can overcome the $1.3880 level before challenging $1.40.
Critical Resistance Levels Under Watch
Should XRP successfully penetrate the $1.40 threshold, technical projections point toward resistance near $1.4250 and $1.4450. Additional obstacles emerge around $1.4650.
In the short-term, $XRP has 3 sell walls until $1.6.
And the $1.34 level is support line. pic.twitter.com/eE8yKroUSP
— CW (@CW8900) April 8, 2026
Near-term technical indicators suggest bulls maintain control of price action. The cryptocurrency remains positioned above its primary moving average following the recent upward momentum.
Market data indicates XRP posted a 5.63% daily gain, reaching approximately $1.3848. Analysis shows the asset trading above its 20-day moving average, though it remains beneath both the 50-day and 200-day moving averages.
Technical readings identify the Ichimoku Kijun at $1.4429. This level represents additional overhead resistance that could challenge further advances.
Downside Support Zones Identified
Should XRP encounter rejection at the $1.3880 resistance area, downward retracement could materialize. Initial support is established near $1.3575.
Beneath that level, significant support emerges around $1.3330. This area coincides with the 61.8% Fibonacci retracement level calculated from the recent swing low of $1.2940 to the high of $1.3963.
A decisive move below $1.3330 could leave $1.3080 and $1.3020 vulnerable. The subsequent major support floor is located near $1.2750.
Market observers noted that XRP has consolidated within a narrow $1.37 to $1.39 corridor despite robust institutional investment activity. Data reveals that US spot XRP ETFs have accumulated over $1 billion in assets since their debut, with $224 million flowing in during the most recent week.
Technical momentum indicators present a mixed picture, with the RSI suggesting bullish tendencies while the Stoch RSI indicates overbought territory. Market analyst Anton Kharitonov expressed a cautious stance, maintaining a defensive position until XRP achieves a decisive break above $1.39.
BOOM! 🚨🚨🚨 $XRP IS BREAKING OUT FROM THE RESISTANCE AFTER THE 2-WEEK CEASEFIRE AND REOPENING OF STRAIT OF HORMUZ COMPLETELY!
This is just the beginning!
Are you ready for a 2 week green candles?
LFG! https://t.co/LJ2Yt5p80y pic.twitter.com/2UEBvAEAbD
— X Finance Bull (@Xfinancebull) April 7, 2026
Finance Bull highlighted XRP’s breakout pattern following geopolitical developments, including the two-week ceasefire and Strait of Hormuz reopening, suggesting potential for extended upward price action. While the outlook expressed strong bullish sentiment, specific technical targets and chart-based projections were not provided.
Currently, the immediate technical picture shows XRP challenging the $1.3880 to $1.40 resistance zone following its advance from the $1.2940 base.