
 Price Faces Pressure Despite Whale Buyers Adding 230M Tokens")
Key Highlights
- Cardano trades near $0.24 following a fortnight of declining prices
- Large holders added 230 million ADA coins from last Wednesday through Monday
- Derivatives markets show a long-to-short ratio of 1.14, indicating bullish positioning
- Price action remains under key exponential moving averages with RSI showing weakness at 41
- Technical analyst Ali Charts identified a channel breakdown targeting $0.22
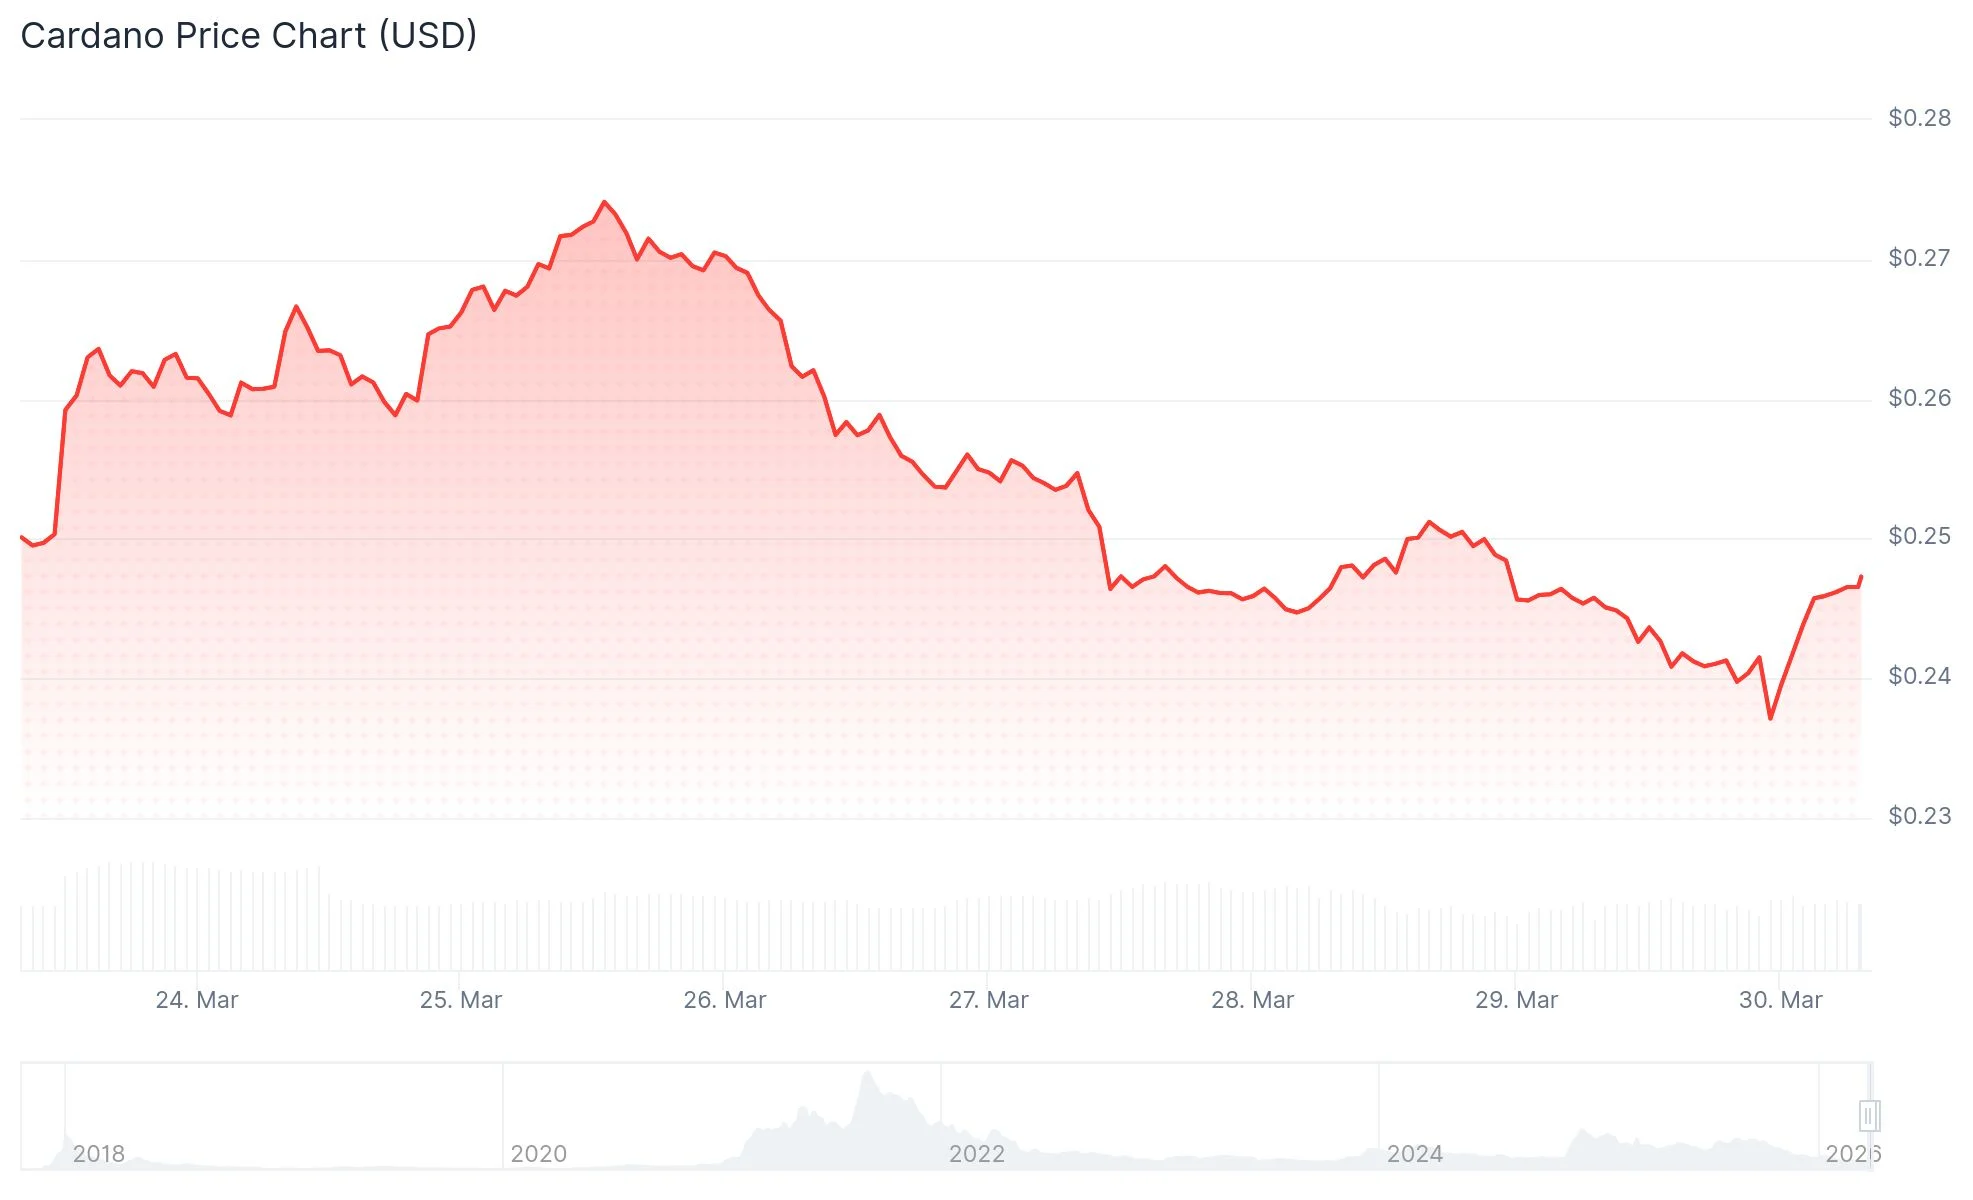
Cardano (ADA) is currently changing hands around the $0.24 mark on Monday, staging a modest rebound following two consecutive weeks of downward pressure. The cryptocurrency remains underwater by over 4% across the weekly timeframe, while chart-based signals continue displaying bearish characteristics.
Despite sluggish price performance, blockchain metrics reveal emerging buying interest from substantial token holders. Santiment’s tracking data indicates that whales controlling between 100,000 to 1 million ADA, alongside those managing 10 million to 100 million ADA, collectively purchased 230 million tokens spanning Wednesday through Monday.
%20%5B08-1774842903642-1774842903642.18.27%2C%2030%20Mar%2C%202026%5D.png&w=1536&q=95)
Buying activity wasn’t universal across all whale categories, though. Address clusters holding 1 million to 10 million ADA offloaded approximately 30 million tokens during the identical timeframe, suggesting potential surrender among this investor segment.
Looking at derivative platforms, CoinGlass metrics indicate ADA’s long-to-short ratio stands at 1.14, approaching its peak level witnessed in more than 30 days. When this ratio exceeds 1, it signals that more market participants are betting on upward movement versus downward action.
CryptoQuant intelligence similarly presents a largely balanced marketplace with modest bullish undertones, displaying substantial whale transactions across both spot and perpetual trading venues.
Chart Analysis Reveals Ongoing Weakness
Regardless of these positive indicators, technical analysis paints a more reserved outlook. ADA continues trading beneath both its 50-day and 100-day exponential moving averages, with both trend lines pointing downward.
The Relative Strength Index registers at 41, indicating subdued momentum while staying above deeply oversold conditions. The MACD line has descended back underneath both the signal line and neutral territory, with histogram bars displaying fresh bearish momentum.
Near-term support establishes itself at $0.23. Slipping through this floor could send Cardano down to the $0.22 level. Looking upward, resistance materializes at $0.26, followed by a more formidable obstacle near $0.29.
Market Observer Highlights Pattern Violation
Cryptocurrency market watcher Ali Charts shared on X that Cardano has violated its established price channel, with this technical development creating a pathway toward $0.22. The observation was published approximately 12 hours prior and corresponds with the wider bearish technical framework visible across numerous indicators.
Cardano $ADA breaks out of the channel, opening the door to $0.22. https://t.co/qRmIyinaJF pic.twitter.com/hZNoEzDF9g
— Ali Charts (@alicharts) March 29, 2026
ADA reached a support region around $0.237 following rejection from $0.275 earlier during the trading week. The Chaikin Money Flow gauge has plunged considerably into negative readings, implying capital is exiting the cryptocurrency.
Continuous pressure against the $0.23 to $0.24 support area is progressively eroding its strength. Should this zone fail to hold, the subsequent significant support level exists at $0.20.