
 Price: Falling Wedge Pattern Sparks Trader Interest")
Key Takeaways
- A falling wedge formation on DOGE’s daily chart suggests potential for significant price movement based on historical patterns.
- Critical resistance levels are positioned at $0.105–$0.11, coinciding with important Fibonacci retracement zones.
- The RSI indicator has bounced back from oversold conditions and is moving toward neutral territory with mild bullish momentum.
- The 50-day EMA presents a significant overhead obstacle, and breaking above it would signal the first genuine indication of trend reversal.
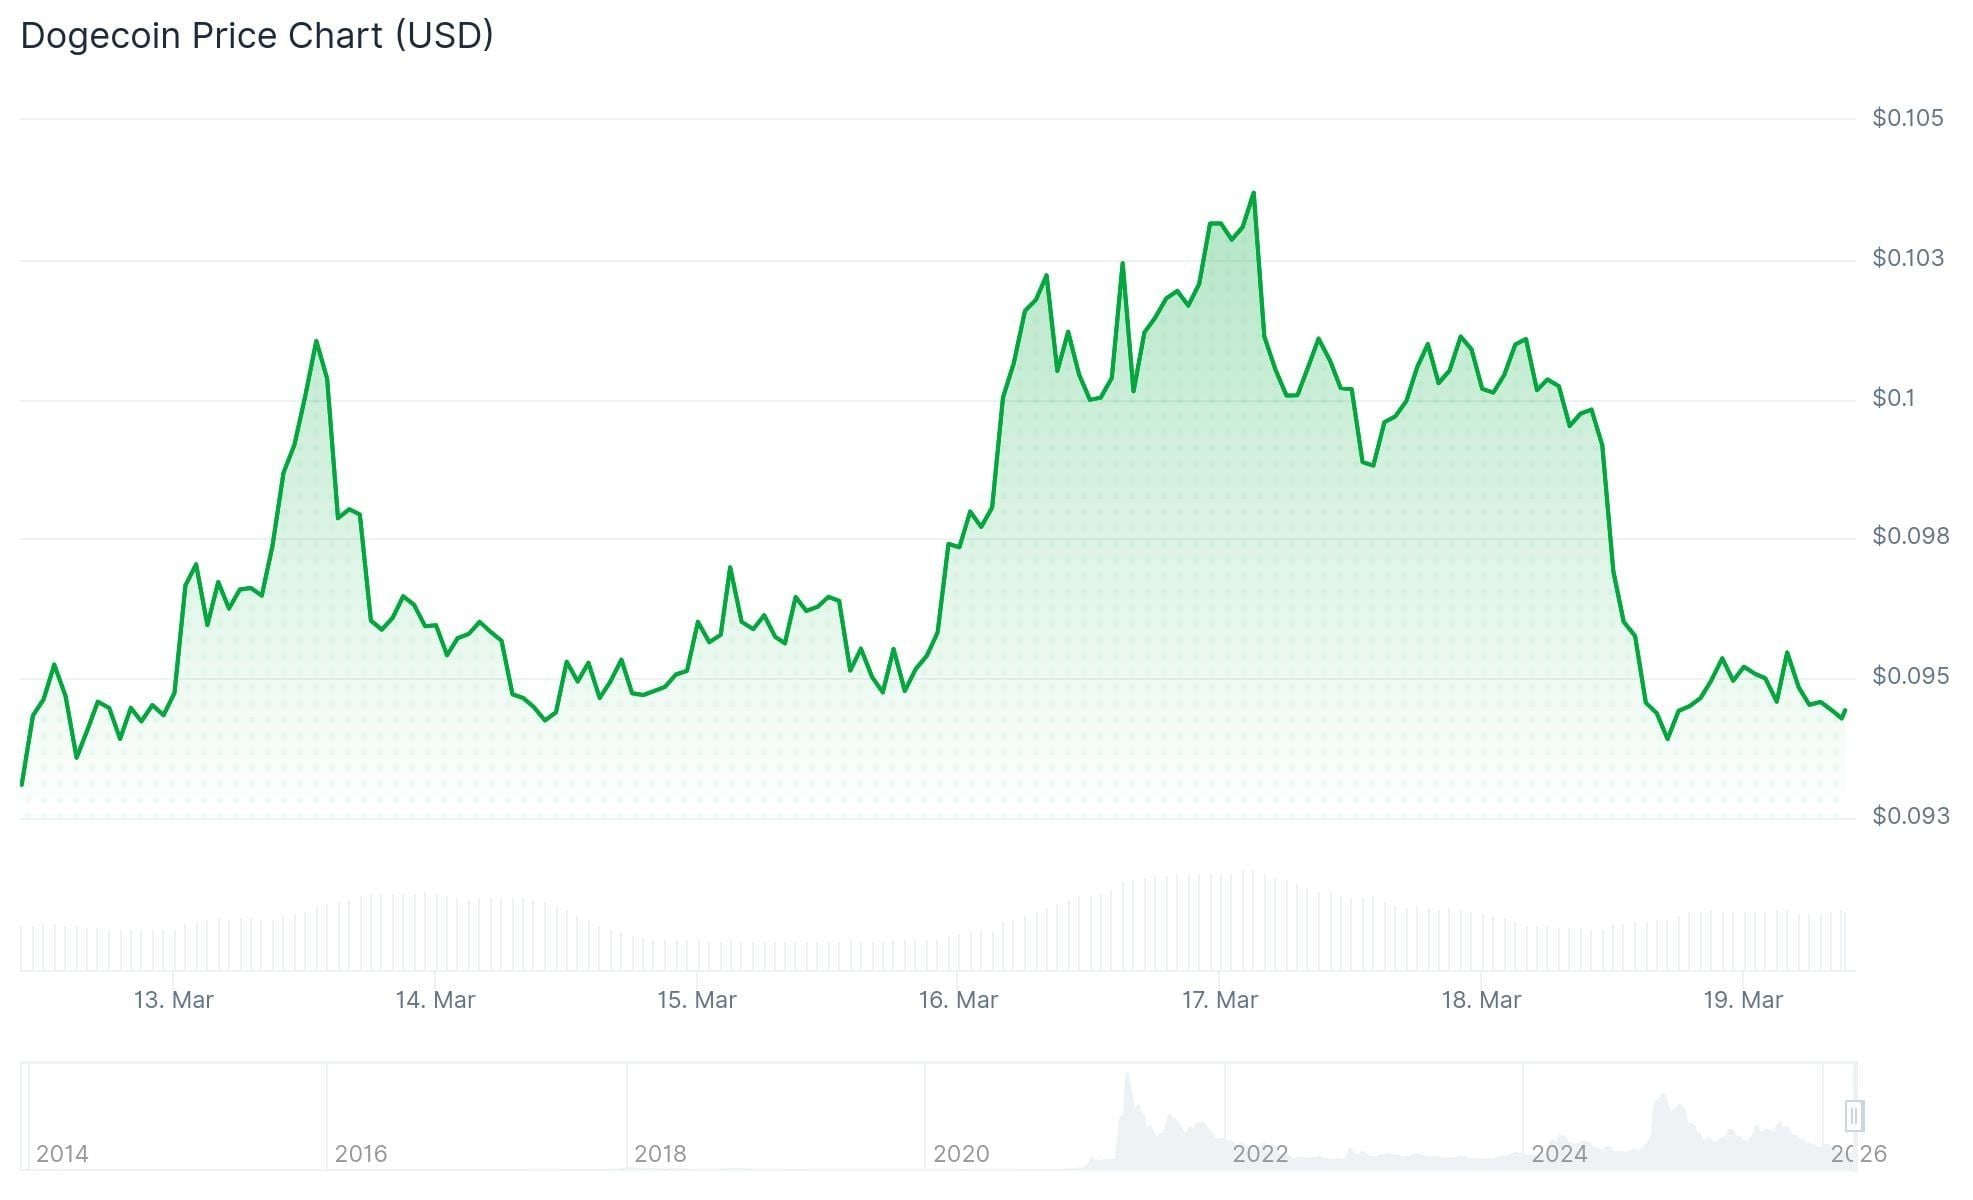
- On March 18, DOGE changed hands around $0.094, declining approximately 5% over the previous 24-hour period.
Dogecoin continues to consolidate around the $0.10 mark, squeezing into a technical formation that has captured market attention. This configuration has generated interest due to its historical implications for substantial price movements—though near-term direction remains uncertain.
Looking at the daily timeframe, DOGE is developing what technical analysts identify as a falling wedge structure. This formation occurs when an asset prints declining peaks while the troughs gradually converge. As the trading range narrows, a breakout typically emerges. Investors who weathered the decline are anticipating an upside resolution.
The pump on $DOGE should trigger a very nice meme season, historically. pic.twitter.com/lMCUCo34aV
— ray 🐂 (@moonbag) March 18, 2026
This consolidation phase started following a corrective wave that came after robust gains earlier. Throughout this period, Dogecoin has recorded diminishing peaks alongside weakening selling activity, indicating that downside pressure may be exhausting itself.
Overhead Barriers Remain Intact
The immediate obstacle for any bullish movement lies within the $0.105 to $0.11 price range. This territory aligns with the 0.5 to 0.618 Fibonacci retracement measurements derived from the latest decline. Additionally, it intersects with several short-duration exponential moving averages, creating a concentrated resistance cluster.
Once you see this Dogecoin $DOGE fractal, you can't unsee it! pic.twitter.com/ML2zpQV1He
— Ali Charts (@alicharts) March 18, 2026
Dogecoin has challenged the $0.10 threshold on numerous occasions throughout the past twelve months. During each instance where it managed to break above, selling pressure reemerged and forced prices lower. Market observers note this recurring pattern has diminished $0.10’s effectiveness as dependable support.
A decisive push beyond $0.11 would pave the way toward $0.116 and subsequently $0.136. However, until such a breakout materializes, the price remains positioned beneath the 50-, 100-, and 200-day moving averages, maintaining the prevailing bearish structure.
As of March 18, DOGE was exchanging hands near $0.094, registering a 4.84% intraday decline.
The 50-Day EMA Represents the Critical Hurdle
Even should DOGE manage to break through $0.11, the 50-day EMA looms overhead and has been shadowing the downward trajectory since the correction commenced. This dynamic moving average recalibrates as price evolves, complicating efforts to maintain any sustained breakthrough.
From a historical perspective, successfully recapturing the 50 EMA has marked the initial reliable indication that DOGE’s trajectory is reversing. Absent this technical confirmation, market analysts view any advance beyond $0.10 as a temporary rebound rather than a genuine trend reversal.
The RSI has climbed from oversold readings and currently hovers around the neutral 50 level with slight bullish characteristics. The MACD indicator is also nearing a possible bullish crossover signal, implying that bearish momentum is diminishing.
Current market data indicates DOGE continues to trade above its extended-term support foundation at $0.086, which marked the most recent local bottom before the ongoing recovery attempt.