
 Bulls Eye Critical $2,400 Threshold for Major Price Breakout")
Key Highlights
- Ethereum is rebounding from long-term support alongside a bullish MACD golden cross, mirroring a technical pattern that preceded a 250% surge in 2025.
- Crypto analyst Cryptorand identifies $2,400 as the critical threshold ETH must reclaim to validate a bullish trend reversal.
- On-chain data reveals Ethereum’s apparent demand reached its highest point in 90 days at 24,111 ETH on April 14.
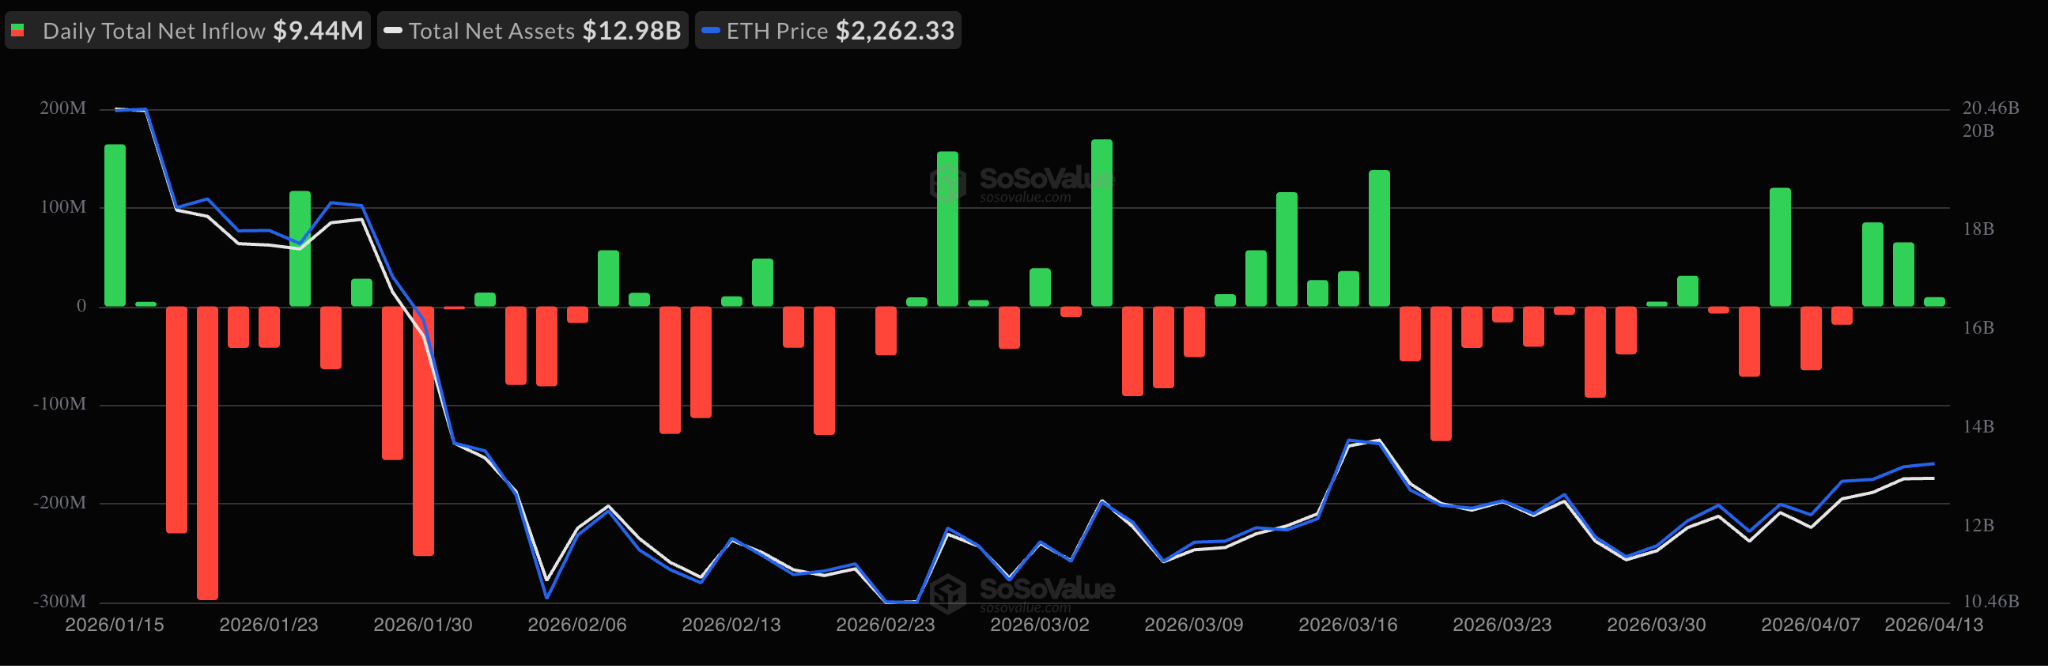
- Institutional interest strengthens as spot Ethereum ETFs attracted $160 million in net inflows across three trading sessions.
- The ETH/BTC trading pair surged to a three-month peak of 0.0313, supported by unprecedented blockchain activity.
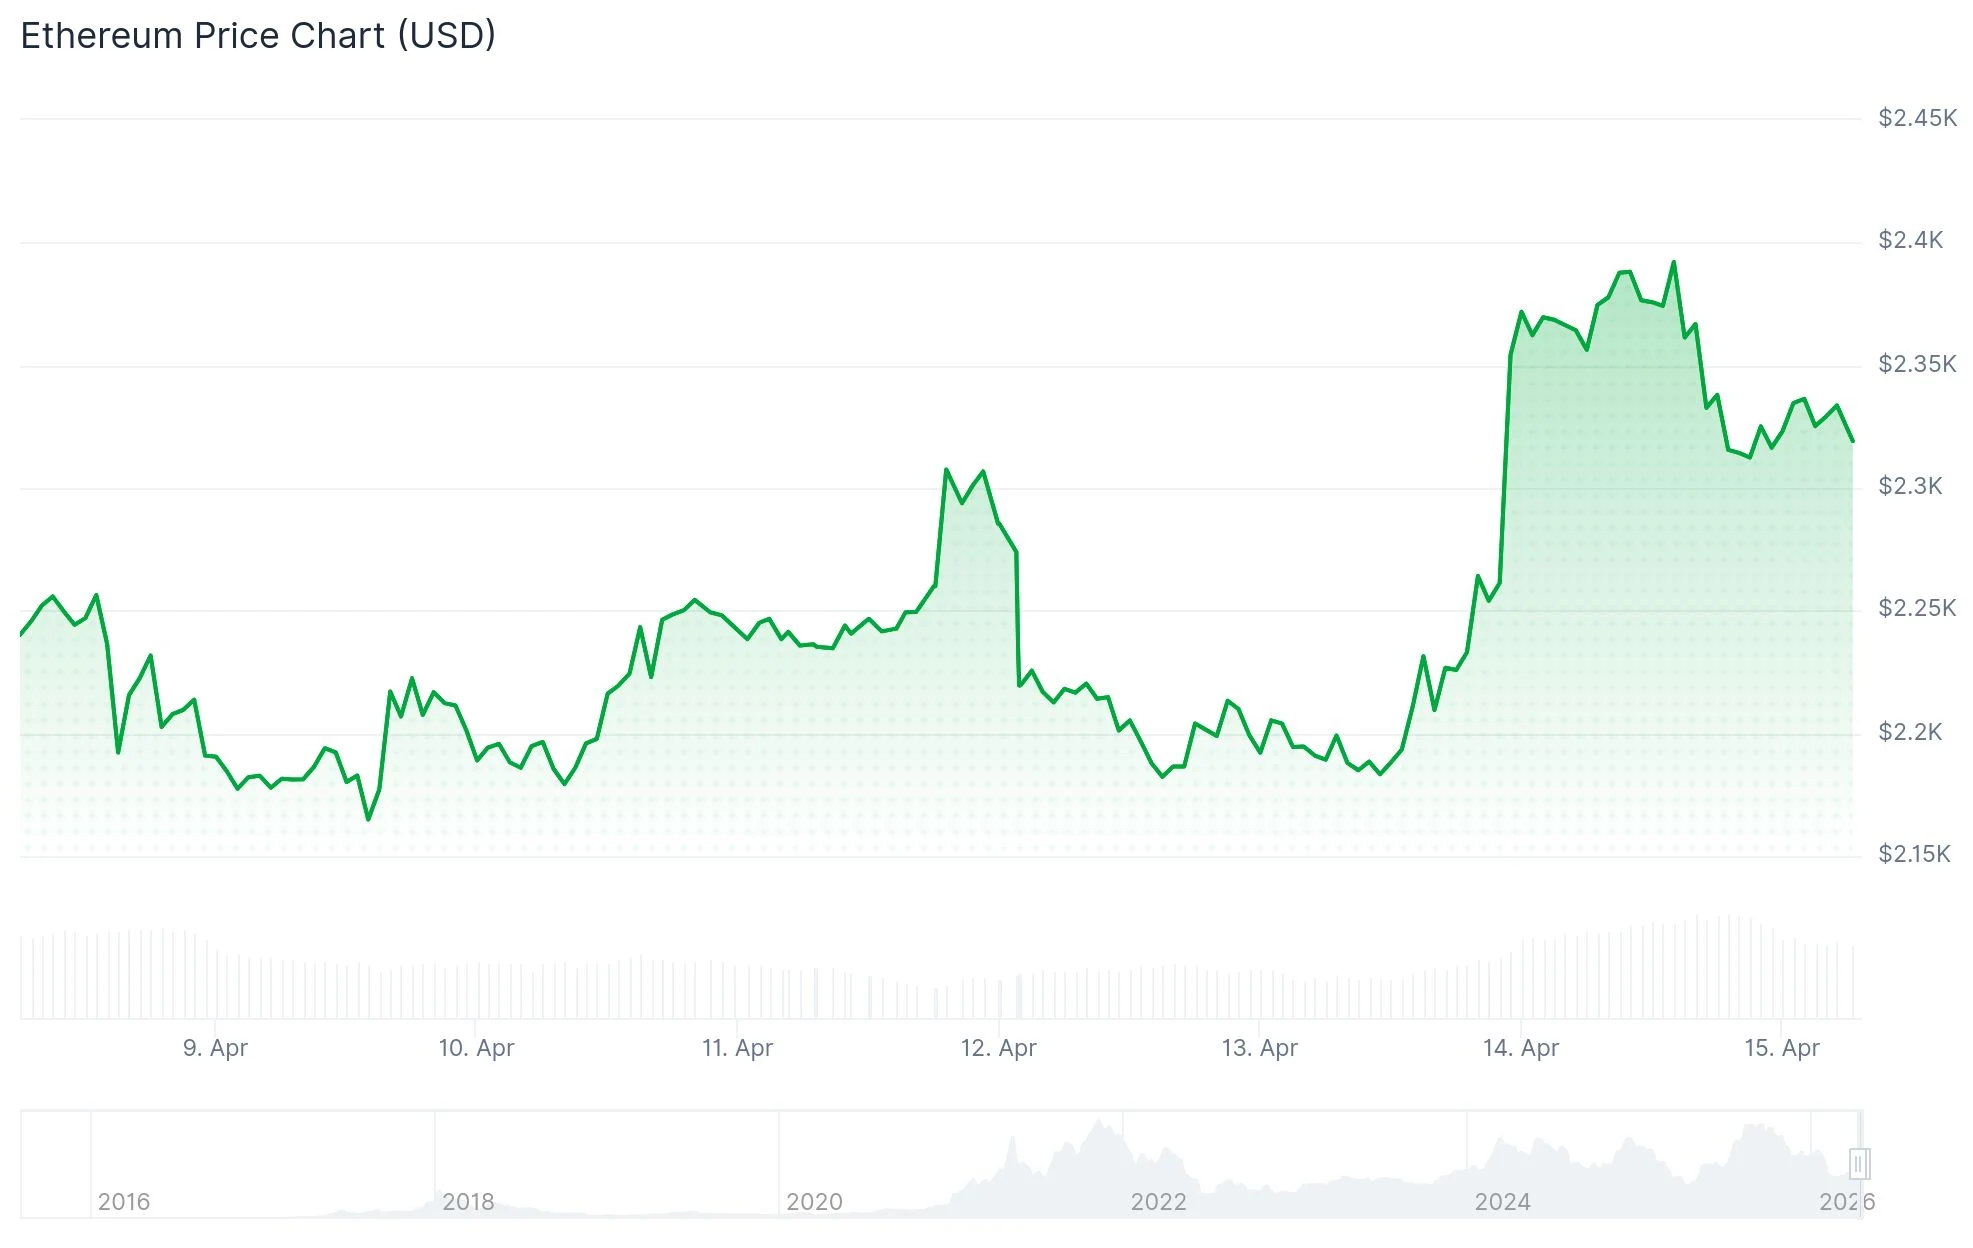
Ethereum (ETH) is currently hovering around the $2,325 mark, registering a 4% gain across the last week. This price movement has captured the attention of market observers who notice striking parallels to a technical configuration that materialized in mid-2025.
Analyzing the weekly timeframe, Ethereum is currently challenging an upward-sloping trendline that has provided crucial support dating back to 2022. Simultaneously, the moving average convergence divergence (MACD) has generated a bullish signal crossover — an identical configuration that appeared before the 250% price explosion witnessed in 2025.
The last three times the MACD printed a golden cross on Ethereum $ETH, the price surged 130%, 74%, and 98%.
What do you think happens now? pic.twitter.com/kn50meaxr4
— Ali Charts (@alicharts) April 15, 2026
Market analyst Max Crypto shared on X: “Comparable framework. Comparable selloff. Comparable consolidation phase. What happens if $ETH duplicates the Q2/Q3 2025 surge?” Should this historical pattern repeat itself, a potential climb toward $6,300 might be within reach.
Cryptorand emphasized that Ethereum must successfully “breach the crucial $2,400 zone” and maintain consolidation above this level to “activate the bullish trend reversal.”
Eyes on $ETH the weekly close will be extremely important. Pushing to cross the key $2,400 range. If manages to consolidate over it will trigger the bullish reversal pic.twitter.com/0fbUULTx5D
— Rand Group (@cryptorand) April 14, 2026
Chartist Ali Charts also drew attention to the MACD configuration, observing that during the previous three instances when this indicator flashed a golden cross for Ethereum, prices subsequently jumped 130%, 74%, and 98% in succession.
Growing Demand and Institutional Participation
Ethereum’s apparent demand indicator, monitored by Capriole Investments, shifted into positive territory on April 8 and climbed to a 90-day peak of 24,111 ETH on April 14. This development coincided with optimism surrounding a possible US-Iran trade agreement that boosted overall market confidence.
CryptoQuant analyst Arab Chain observed that the ETH Coinbase Premium Index — which tracks the price differential between Coinbase and Binance — advanced to 0.055, marking its strongest reading since October 2025. He interpreted this as evidence of “heightened demand from institutional investors, especially within the US marketplace.”
Spot Ethereum ETFs documented consecutive net inflows spanning three days, accumulating $160 million total. Additionally, worldwide Ethereum ETPs registered $196.5 million in capital inflows throughout the previous week.
Blockchain Metrics and Network Activity
The ETH/BTC price ratio advanced to 0.0313 on Wednesday, representing its highest level in three months. Fresh participants joining the Ethereum ecosystem skyrocketed 82% quarter-over-quarter during Q1 to reach 284,000, while aggregate transactions achieved an unprecedented 200.4 million — reflecting a 43% quarterly expansion.
Stablecoin circulation on Ethereum touched an all-time peak of $180 billion. The blockchain currently commands approximately 60% of the worldwide stablecoin ecosystem.
Despite these encouraging indicators, ETH continues trading more than 50% beneath its 52-week zenith of $4,831. Market analysts suggest the ratio must successfully reclaim the 0.035 level on a weekly closing basis to validate a sustainable upward trajectory.
Santiment data revealed that addresses containing 0.01 ETH or fewer decreased their holdings by 1,791 ETH ($4.16M) during the past 48 hours, suggesting smaller retail participants may be interpreting the recent 17% price increase since March 29 as a false breakout.