
 Price Eyes Critical Breakout Above $2,100 – Key Levels to Monitor")
Quick Overview
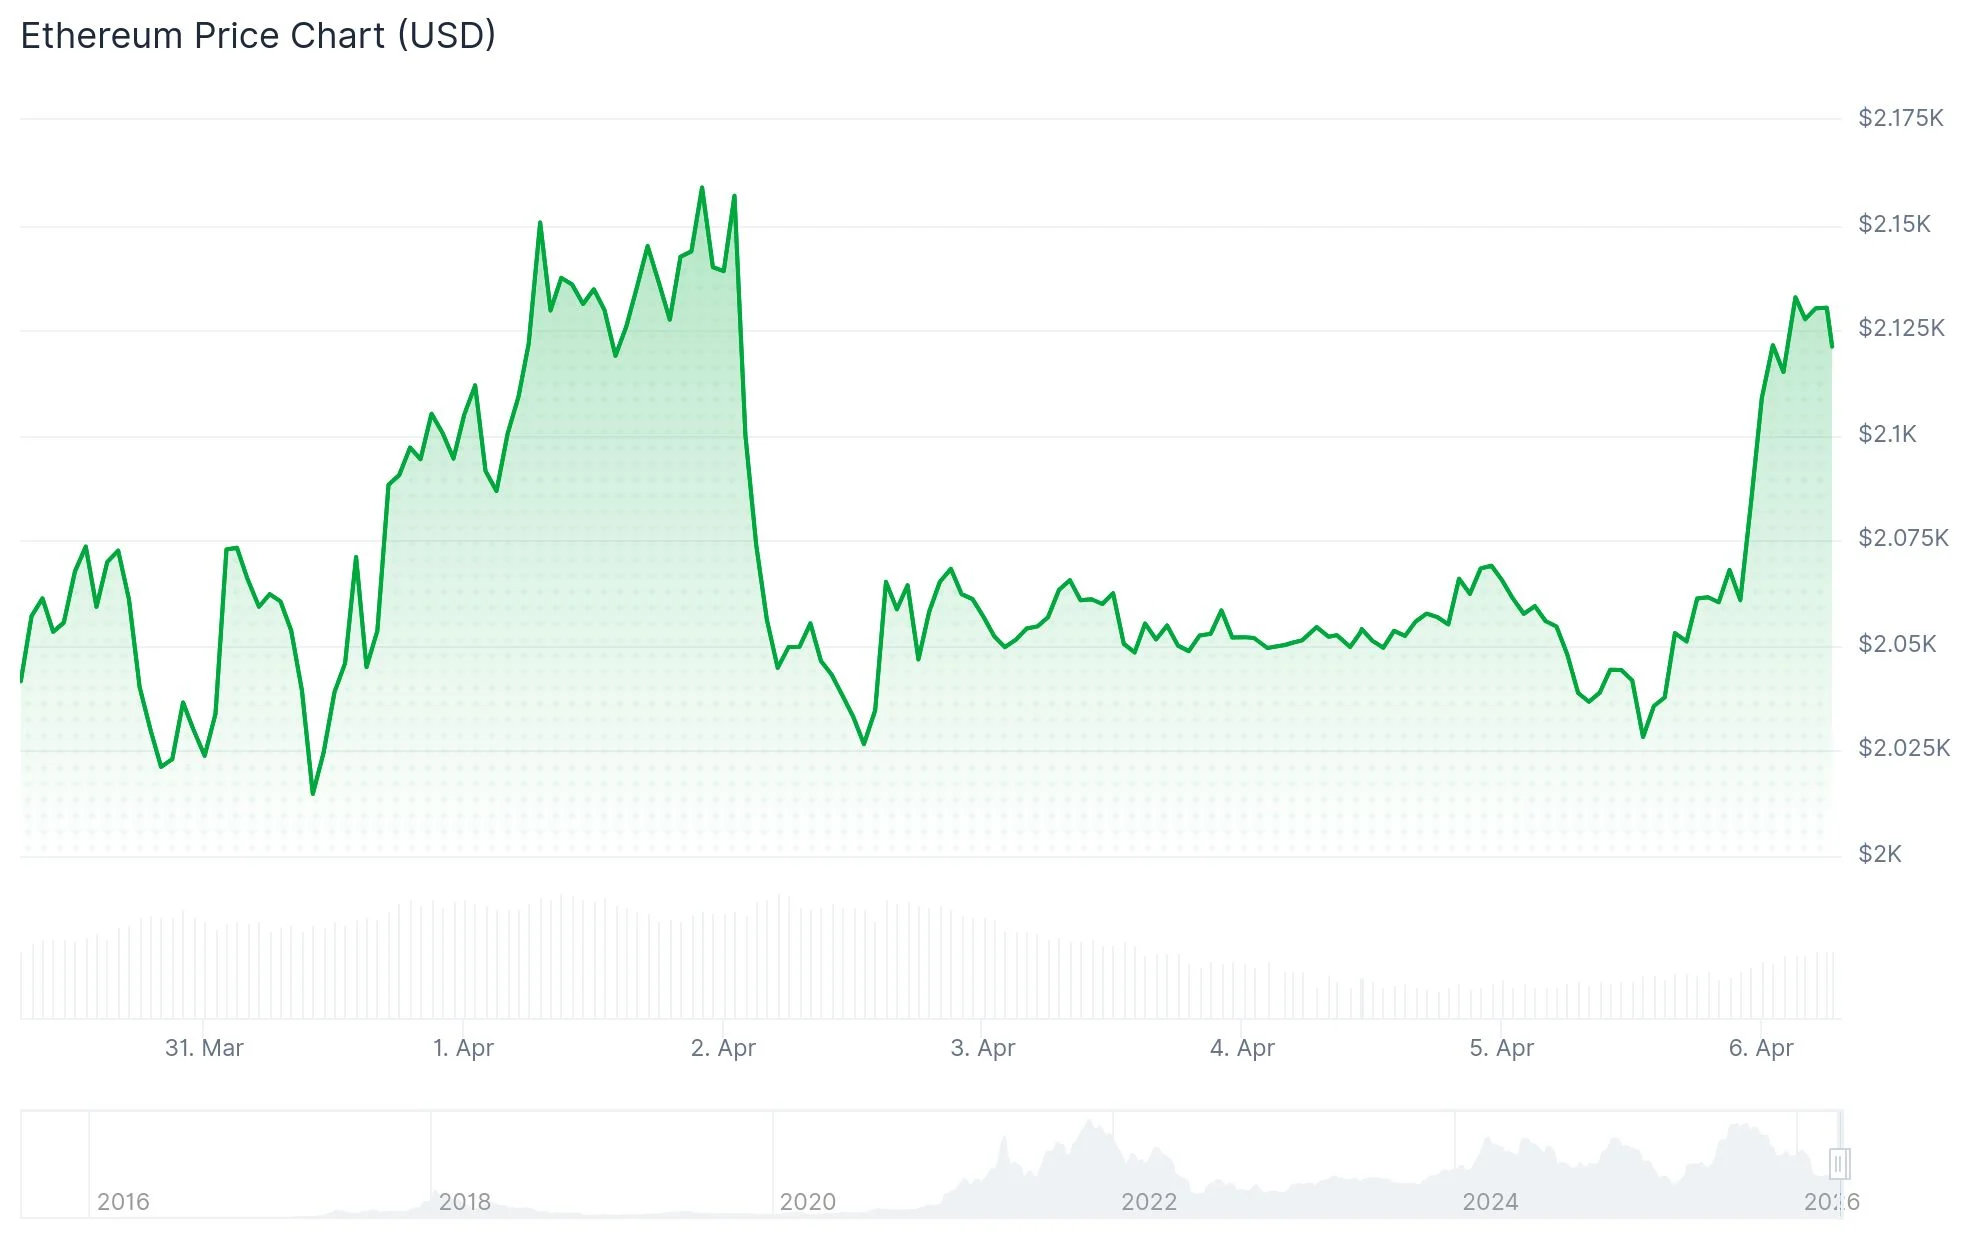
- ETH has climbed back above $2,080, facing immediate resistance at $2,150
- Support at $2,000 remains crucial — a breakdown could spark widespread long liquidations
- Breaking through $2,150–$2,180 resistance may pave the way toward $2,220–$2,350
- Multi-year chart reveals an ascending channel pattern established since 2022
- Technical analyst Ali Charts identifies $1,551 and $1,070 as significant support zones if the channel fails
Ethereum has climbed back above the $2,080 mark following a rebound from lows around $2,017. The digital asset successfully breached a downward trend line at $2,065 on the one-hour timeframe and is currently positioned above its 100-hour Simple Moving Average.
This upward movement carried ETH beyond the 50% Fibonacci retracement point measured from the $2,168 peak down to the $2,017 bottom. Currently, the price is approaching the 83.2% Fibonacci level around $2,140, which aligns with a significant resistance area.
Traders are closely monitoring the $2,150 mark as the critical level. This zone has proven to be a stubborn obstacle during multiple attempts, establishing itself as a formidable short-term ceiling. For the bullish momentum to continue, buyers must decisively push through this barrier.
Should ETH successfully breach $2,150, the subsequent resistance zone emerges at $2,180. Clearing that hurdle could bring $2,220 into play, with extended targets at $2,350 and $2,380 if momentum persists.
Potential Downside Scenarios if Resistance Holds
If Ethereum encounters rejection at $2,150, the first support zone appears at $2,080, with additional backing at $2,065. Slipping beneath $2,065 would likely send ETH toward $2,020, with deeper support levels identified at $1,980 and $1,965.
$ETH has been going sideways for now.
For an upside move, Ethereum needs to break above the $2,100-$2,150 level.
Meanwhile, if ETH loses the $2,000 level, a huge long liquidation wipeout will happen. pic.twitter.com/9cURSLExZ4
— Ted (@TedPillows) April 4, 2026
Market analyst Ted emphasized the significance of the $2,000 threshold. A decisive move below this psychological level could unleash a cascade of liquidations, as numerous leveraged long positions are concentrated around this price point. Such forced selling pressure could potentially drive prices toward $1,755 or even $1,693.
The near-term outlook presents a clear binary scenario. Ethereum is either consolidating for a breakout above $2,150 or faces heightened downside risk if support at $2,000 gives way.
Broader Technical Picture Remains Constructive
Looking at the bigger picture, technical analyst James Easton UK highlighted a chart depicting Ethereum trading within an ascending channel formation dating back to 2022. The lower boundary has consistently provided support during significant corrections, with demand emerging reliably near this trendline.
The upper channel boundary has also been tested during bullish rallies, forming a well-defined pattern where substantial pullbacks haven’t compromised the overall uptrend. This structural framework remains valid provided the rising support trendline continues to hold.
If Ethereum $ETH is trading within a channel, $1,551 and $1,070 are key support levels. pic.twitter.com/iTrcZtvvSs
— Ali Charts (@alicharts) April 3, 2026
In a post on X, analyst Ali Charts noted that assuming ETH maintains its channel trajectory, $1,551 and $1,070 represent the primary support levels worth watching beneath current valuations.
As of April 6, 2026, Ethereum has gained 0.55% and is changing hands above $2,080, with bulls preparing to challenge the $2,150 resistance zone.