
 Price Hits First Bullish SuperTrend Signal Since May 2024")
Quick Overview
- Ethereum surged 9% during Monday’s trading session but encountered strong resistance at the $2,200 price level
- The 50-day exponential moving average at $2,200 presents significant resistance, while the 50-day simple moving average at $2,000 provides crucial support
- Ethereum ETF products recorded negative flows once again, totaling more than $27.5 million in net withdrawals for the week concluding March 20
- Successfully breaching the $2,200 barrier could establish a price objective of $3,080 according to symmetrical triangle chart analysis
- For the first time since May of the previous year, the daily SuperTrend indicator has shifted to a bullish stance (green)
The recent upward momentum in Ethereum’s price encountered a significant obstacle at the $2,200 threshold on Monday, despite a key technical indicator displaying its first positive signal in approximately ten months.
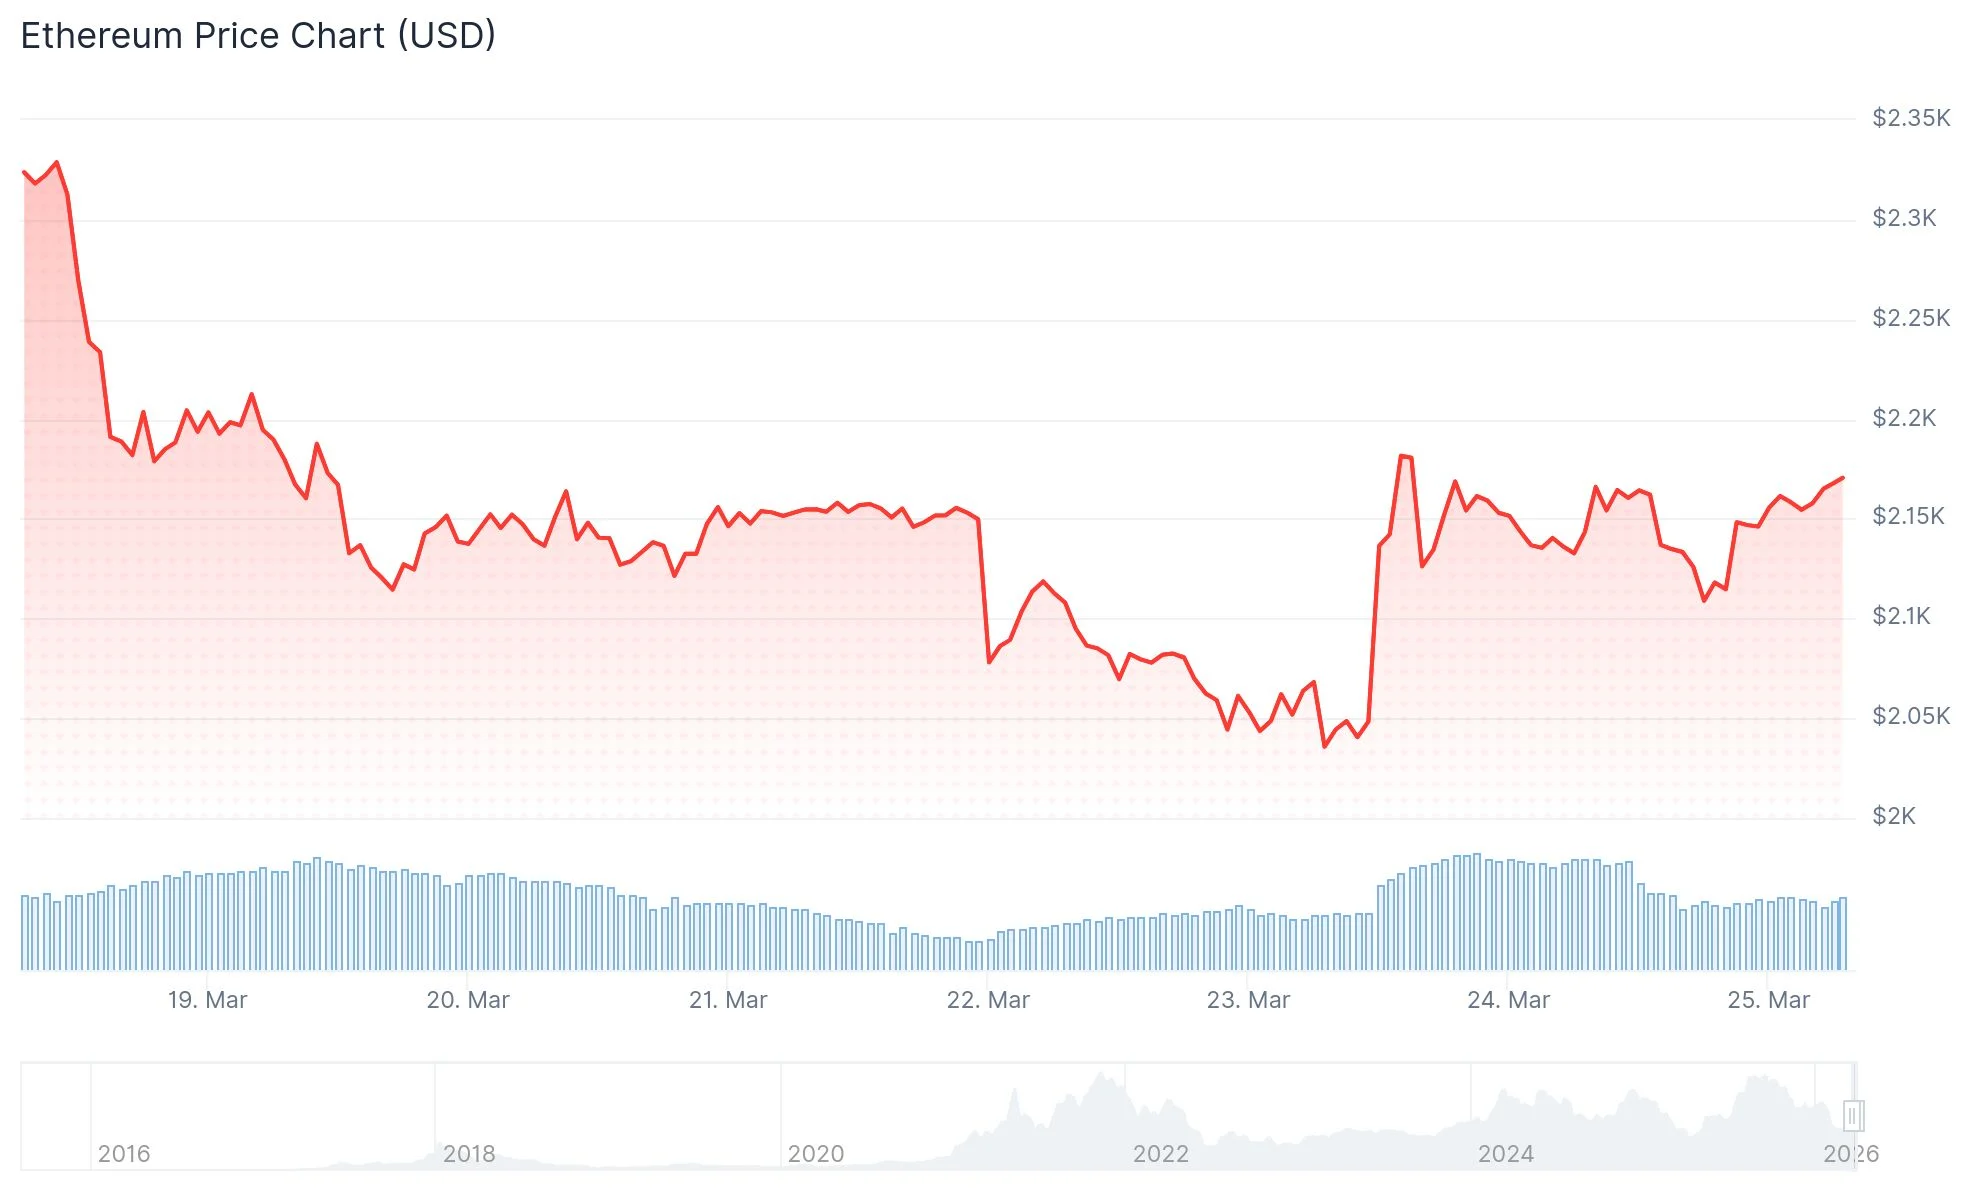
ETH experienced approximately 9% appreciation during Monday’s session but failed to breach the critical $2,200 mark. This price point coincides precisely with the 50-day exponential moving average (EMA), creating substantial overhead pressure.
Current trading activity shows ETH above the $2,120 level and positioned above the 100-hour simple moving average. The asset has also successfully penetrated a near-term descending trend line that previously capped price action at $2,145 on the hourly timeframe.
Critical Support and Resistance Zones
The most immediate hurdles lie at $2,180 and subsequently $2,200. Breaking through these levels would open pathways toward $2,250, $2,300, and potentially $2,345.
$ETH has reclaimed the $2,150 level.
This is because the market expects a US-Iran ceasefire and is now pricing it.
During a downtrend, most peaks happen on good news, and the same will happen with Ethereum. pic.twitter.com/fB0Ij8XL5c
— Ted (@TedPillows) March 24, 2026
Should ETH successfully establish itself above $2,200 with conviction, technical analysis of the symmetrical triangle formation suggests a projected upside target of $3,080, representing approximately 42% gains from present valuations.
Nevertheless, advancing toward that objective would require overcoming significant resistance concentrated between $2,780 and $2,880. This zone represents a confluence of the 200-day EMA, 50-week EMA, and 100-week EMA. According to Glassnode analytics, investor accumulation of over 7.5 million ETH occurred within the $2,750–$2,850 price corridor.
Regarding downside risk, should the $2,000 support level crumble, market analyst Ted Pillows highlighted in an X platform post: “Now, the only crucial support level for Ethereum is $2,000 and if ETH loses it, the dump will accelerate to new lows.” The pessimistic triangle formation indicates a potential decline toward $1,400.
Institutional Demand Remains Weak
A significant challenge confronting ETH currently stems from lackluster institutional interest. Spot Ethereum ETF flows have reversed to negative territory following a short-lived period of net inflows. The 30-day moving average for US-based spot ETH ETF flows has returned to negative values.
Worldwide Ethereum investment vehicles experienced net withdrawals exceeding $27.5 million during the week that concluded on March 20.
Corporate treasury allocations to ETH have experienced a dramatic decline since August 2025. The notable exception remains Bitmine Immersion Technologies, under Tom Lee’s leadership, which purchased $139 million worth of ETH in the previous week. Bitmine’s holdings now total 4.66 million ETH, approaching its publicly announced objective of acquiring 5% of the circulating supply.
Momentum is finally shifting back to the Ethereum $ETH bulls. The SuperTrend on the daily chart has turned green (bullish) for the first time since May last year.
This suggests the long period of "sideways grind" is ending, and as long as the $1,800 support holds, a new uptrend… https://t.co/BDiUteQrYS pic.twitter.com/dmlRyOETGB
— Ali Charts (@alicharts) March 24, 2026
Providing a more optimistic perspective, cryptocurrency analyst Ali Charts shared on X: “Momentum is finally shifting back to the Ethereum $ETH bulls. The SuperTrend on the daily chart has turned green (bullish) for the first time since May last year. This suggests the long period of ‘sideways grind’ is ending, and as long as the $1,800 support holds, a new uptrend could begin.”
Bitmine continues to stand alone as the sole corporate entity actively expanding its ETH treasury position, with aggregate holdings currently reaching 4.66 million ETH.