
 Price Hovers at Critical Support — What’s Next for ETH?")
Quick Overview
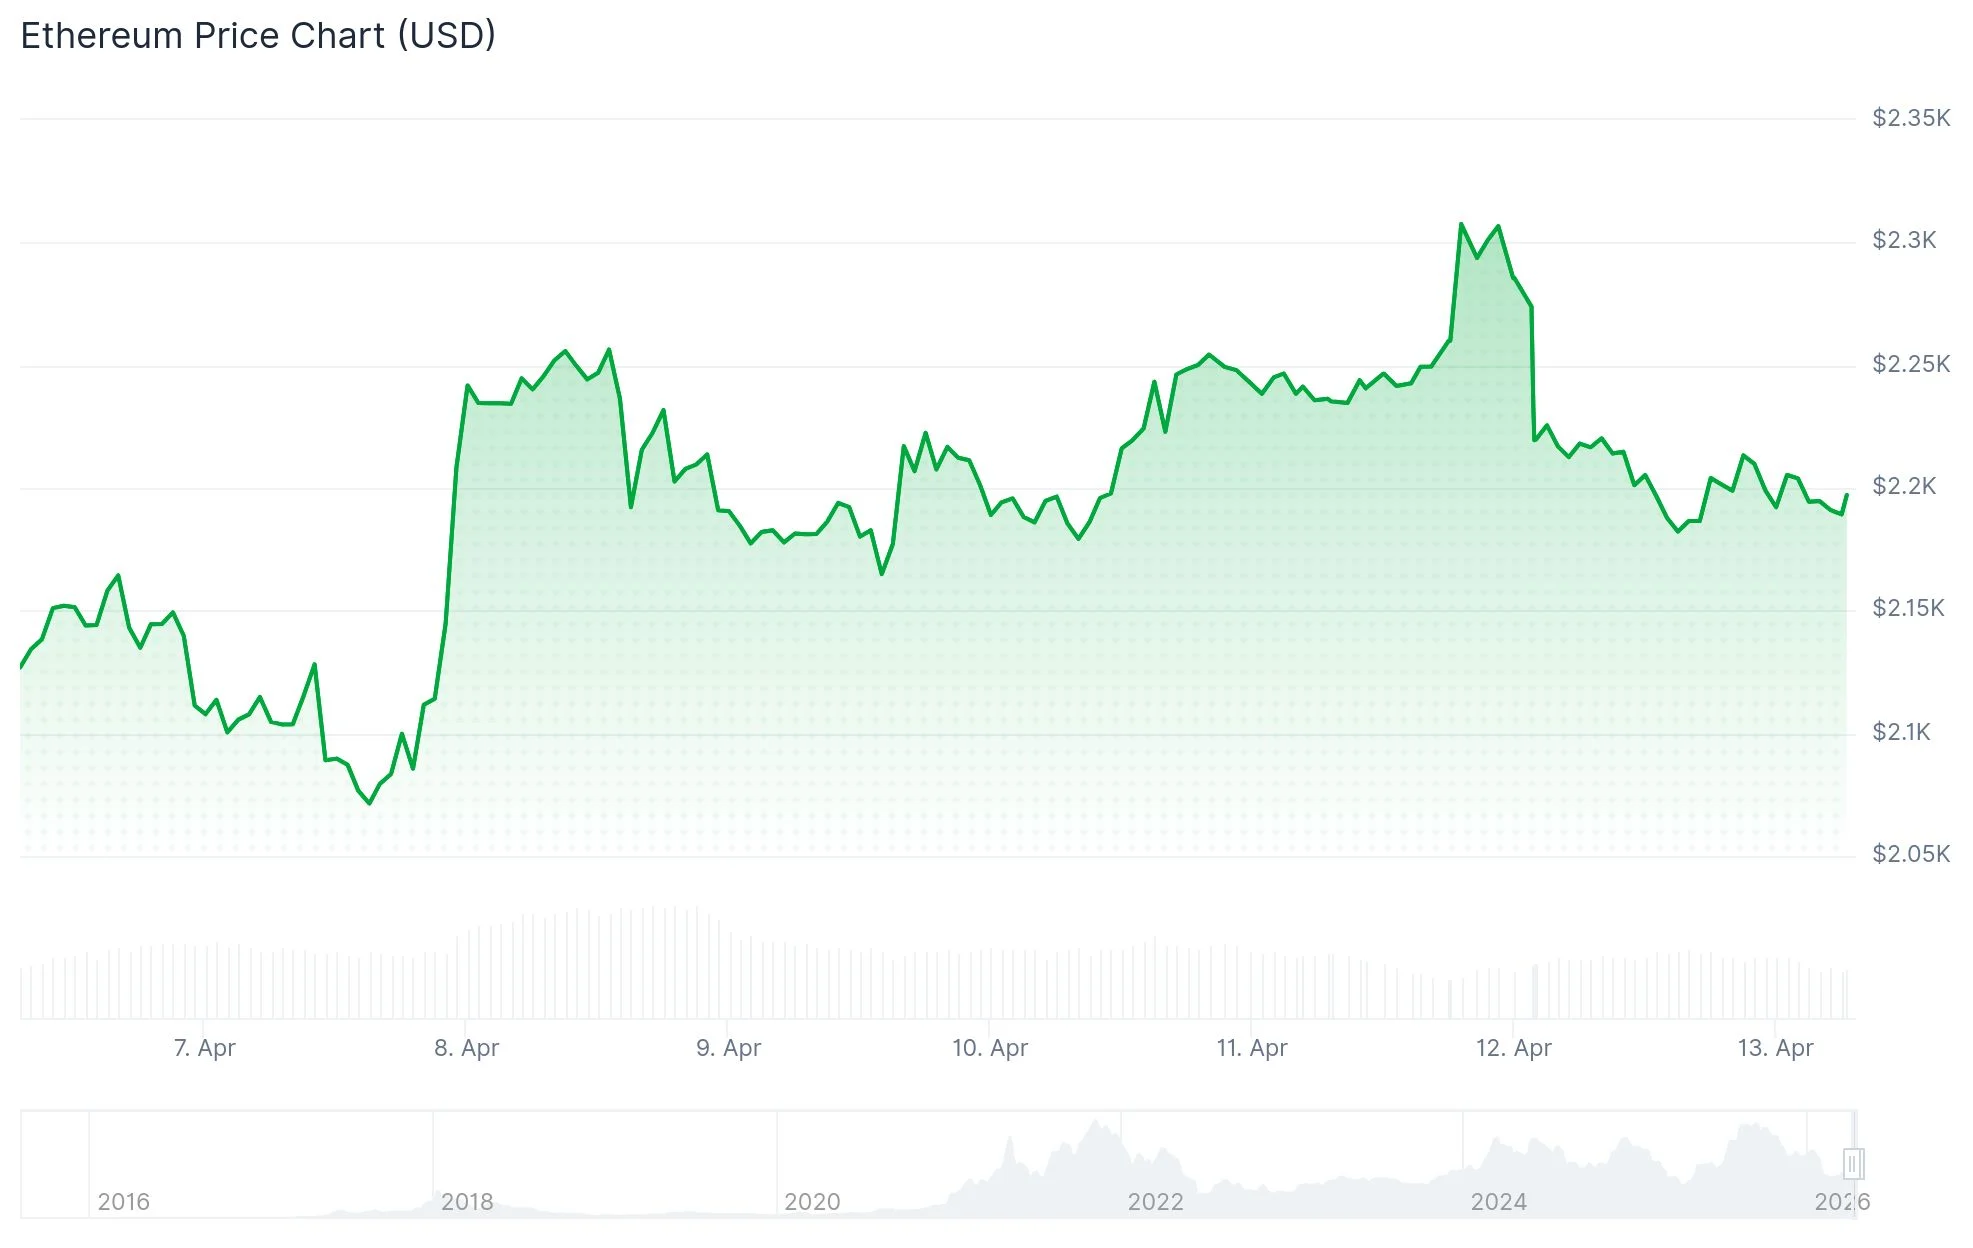
- Ethereum is currently hovering around $2,181, positioned within a critical support range of $2,150 to $2,200.
- Breaking below the $2,150 threshold may lead ETH toward the psychologically significant $2,000 mark.
- Technical indicators show RSI at 53.53, with ETH positioned above short-term moving averages but trailing longer-term trends.
- Long-term chart patterns from Ali Charts suggest potential deeper support zones at $1,550 and $1,070.
- Holding current levels could enable a bounce toward $2,400, with extended upside targeting $2,624.
Ethereum has positioned itself at a critical juncture that market participants are monitoring with heightened attention. Currently, ETH is changing hands at $2,181.19, reflecting a 2.89% decline in the last 24-hour period. Daily trading activity has reached $28.19 billion, while the network maintains a market capitalization of $263.38 billion.
Market observers are zeroing in on the $2,150–$2,200 range as the decisive battleground. Market analyst Ted highlighted on X that Ethereum nearly slipped beneath $2,200 recently, influenced by widespread risk aversion affecting global financial markets. According to his assessment, this price corridor represents where market participants are expected to establish their positions.
$ETH almost dropped to $2,200 today.
This happened after US-Iran talks failed, which means things could escalate again.
The key level for Ethereum here is $2,150-$2,200 and if that holds, ETH could push for another leg up higher.
Losing this zone means ETH will dump towards… pic.twitter.com/7eOBkpYcqJ
— Ted (@TedPillows) April 12, 2026
Should ETH maintain its position above the $2,150 threshold, near-term projections suggest sideways movement followed by a potential advance toward $2,400. This price point represents the initial significant resistance barrier. Beyond that milestone, technical charts identify $2,624 as the subsequent upside objective.
Conversely, a breach of $2,150 would likely direct attention toward $2,000 — a whole-number benchmark that has historically functioned as a psychological support barrier.
Technical Metrics Reveal Balanced Conditions
From a technical standpoint, the Relative Strength Index currently registers 53.53, marginally exceeding its average of 53.40. This measurement suggests a mild bullish tilt without demonstrating forceful directional momentum.
Ethereum is positioned above both its 20-day SMA ($2,117.30) and 50-day SMA ($2,080.00), indicating that immediate support structures remain intact. Nevertheless, the asset trades beneath its 100-day SMA of $2,360.14 and its 200-day SMA of $2,918.05. This configuration suggests the extended trend carries downward pressure.
The MACD indicator shows the MACD line marginally above its signal line, potentially signaling early price stabilization. However, market observers emphasize that additional accumulation is necessary before confirming a definitive reversal.
Extended Timeframe Analysis Identifies $1,550 and $1,070 Zones
Crypto analyst Ali Charts shared a weekly Ethereum chart on X demonstrating that Ethereum could be operating within a defined parallel channel. The analysis identifies two significant downside benchmarks: $1,550 and $1,070.
If the governing pattern behind Ethereum $ETH is actually a Parallel Channel, then I'll be watching $1,550 and $1,070 as the ultimate support levels. https://t.co/93y0hrX297 pic.twitter.com/snECHdaFy5
— Ali Charts (@alicharts) April 11, 2026
These price points carry technical significance — both correspond with historical reaction zones visible on the weekly timeframe. The $1,550 level would serve as the primary support floor should present levels collapse. Beneath that, $1,070 represents the more substantial downside cushion.
Daily chart analysis further indicates that losing the $2,155 area would likely direct price action toward approximately $2,015. Falling below that would bring $1,775 into focus as an additional support territory.
As of April 13, 2026, Ethereum trades at $2,181.19, with the $2,150 level serving as the critical threshold determining immediate price trajectory.