
 Eyes 30% Surge If Critical $90 Support Level Remains Intact")
TLDR
- Solana maintains its position around the $89–$90 price zone as buyers defend this critical threshold.
- Successfully clearing $90 resistance could propel SOL toward $120, representing approximately 30% upside.
- Monthly trading activity surged 30%, with volume briefly touching $5 billion levels.
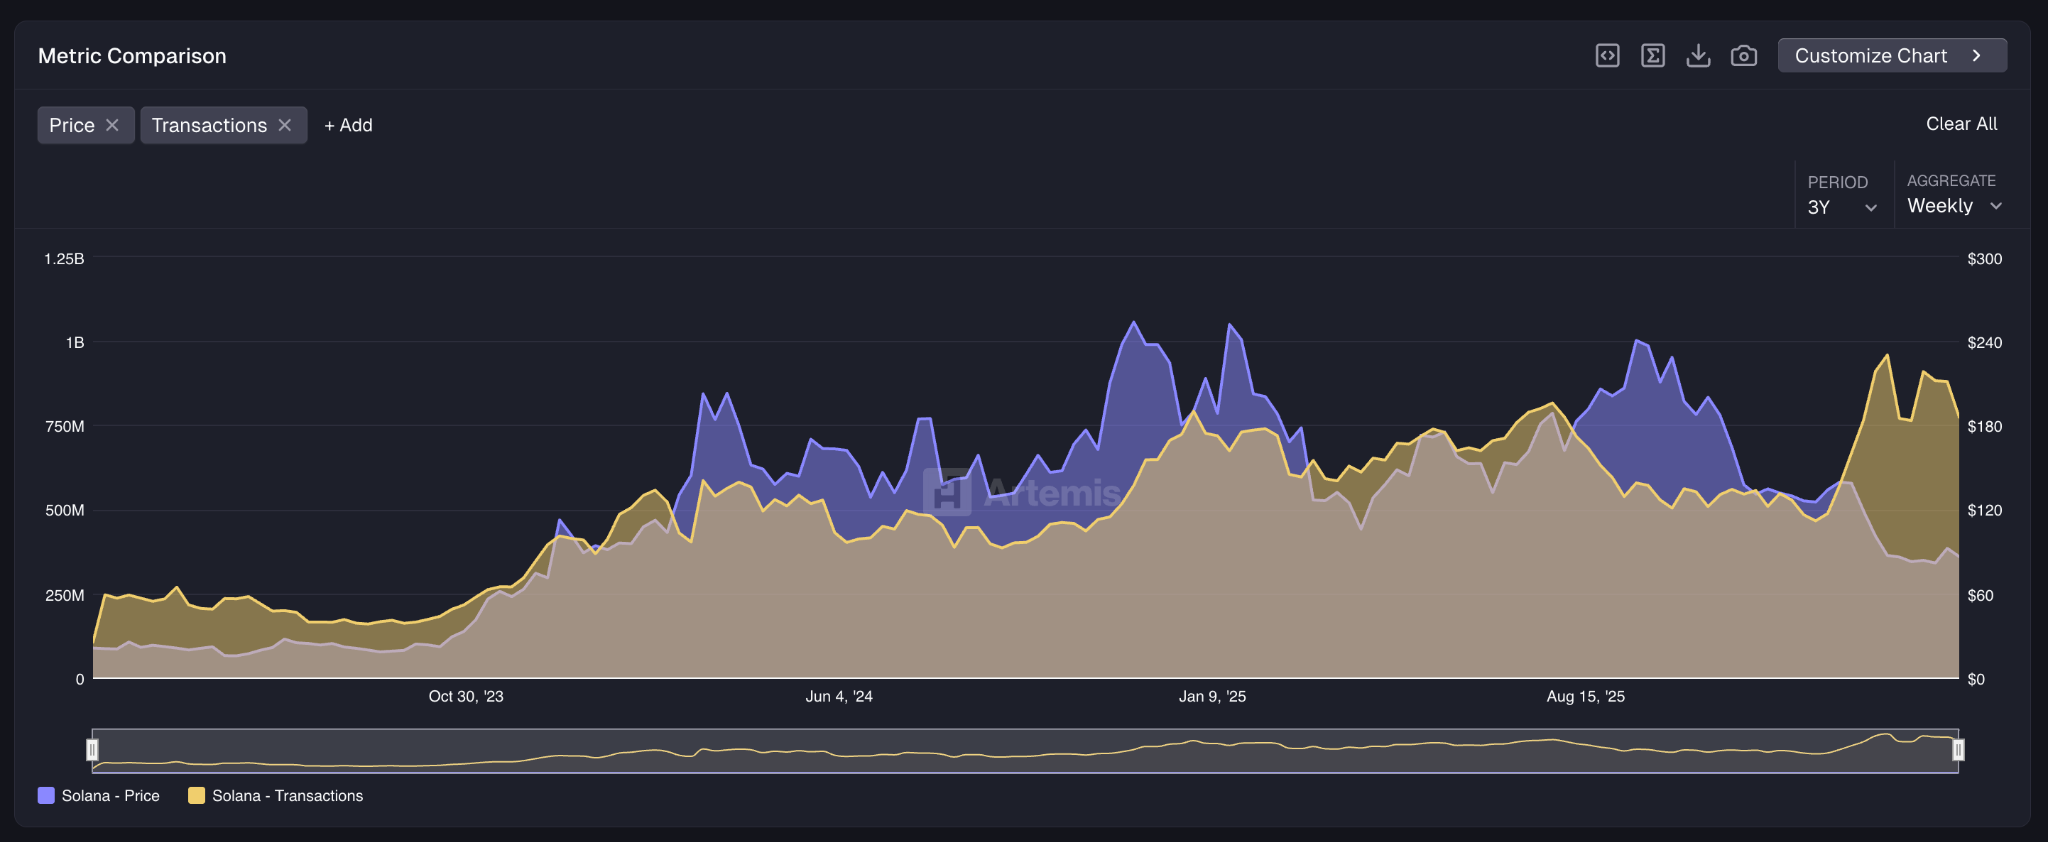
- Network transactions declined 20% from recent highs, indicating reduced on-chain activity.
- Market analyst Crypto Patel identifies a monthly bullish engulfing pattern as the critical indicator for substantial price appreciation.
Solana continues to consolidate near the $90 threshold as market participants engage in a tug-of-war over this pivotal price point. The upcoming sessions will likely determine whether SOL advances toward higher levels or retreats to test lower support zones.
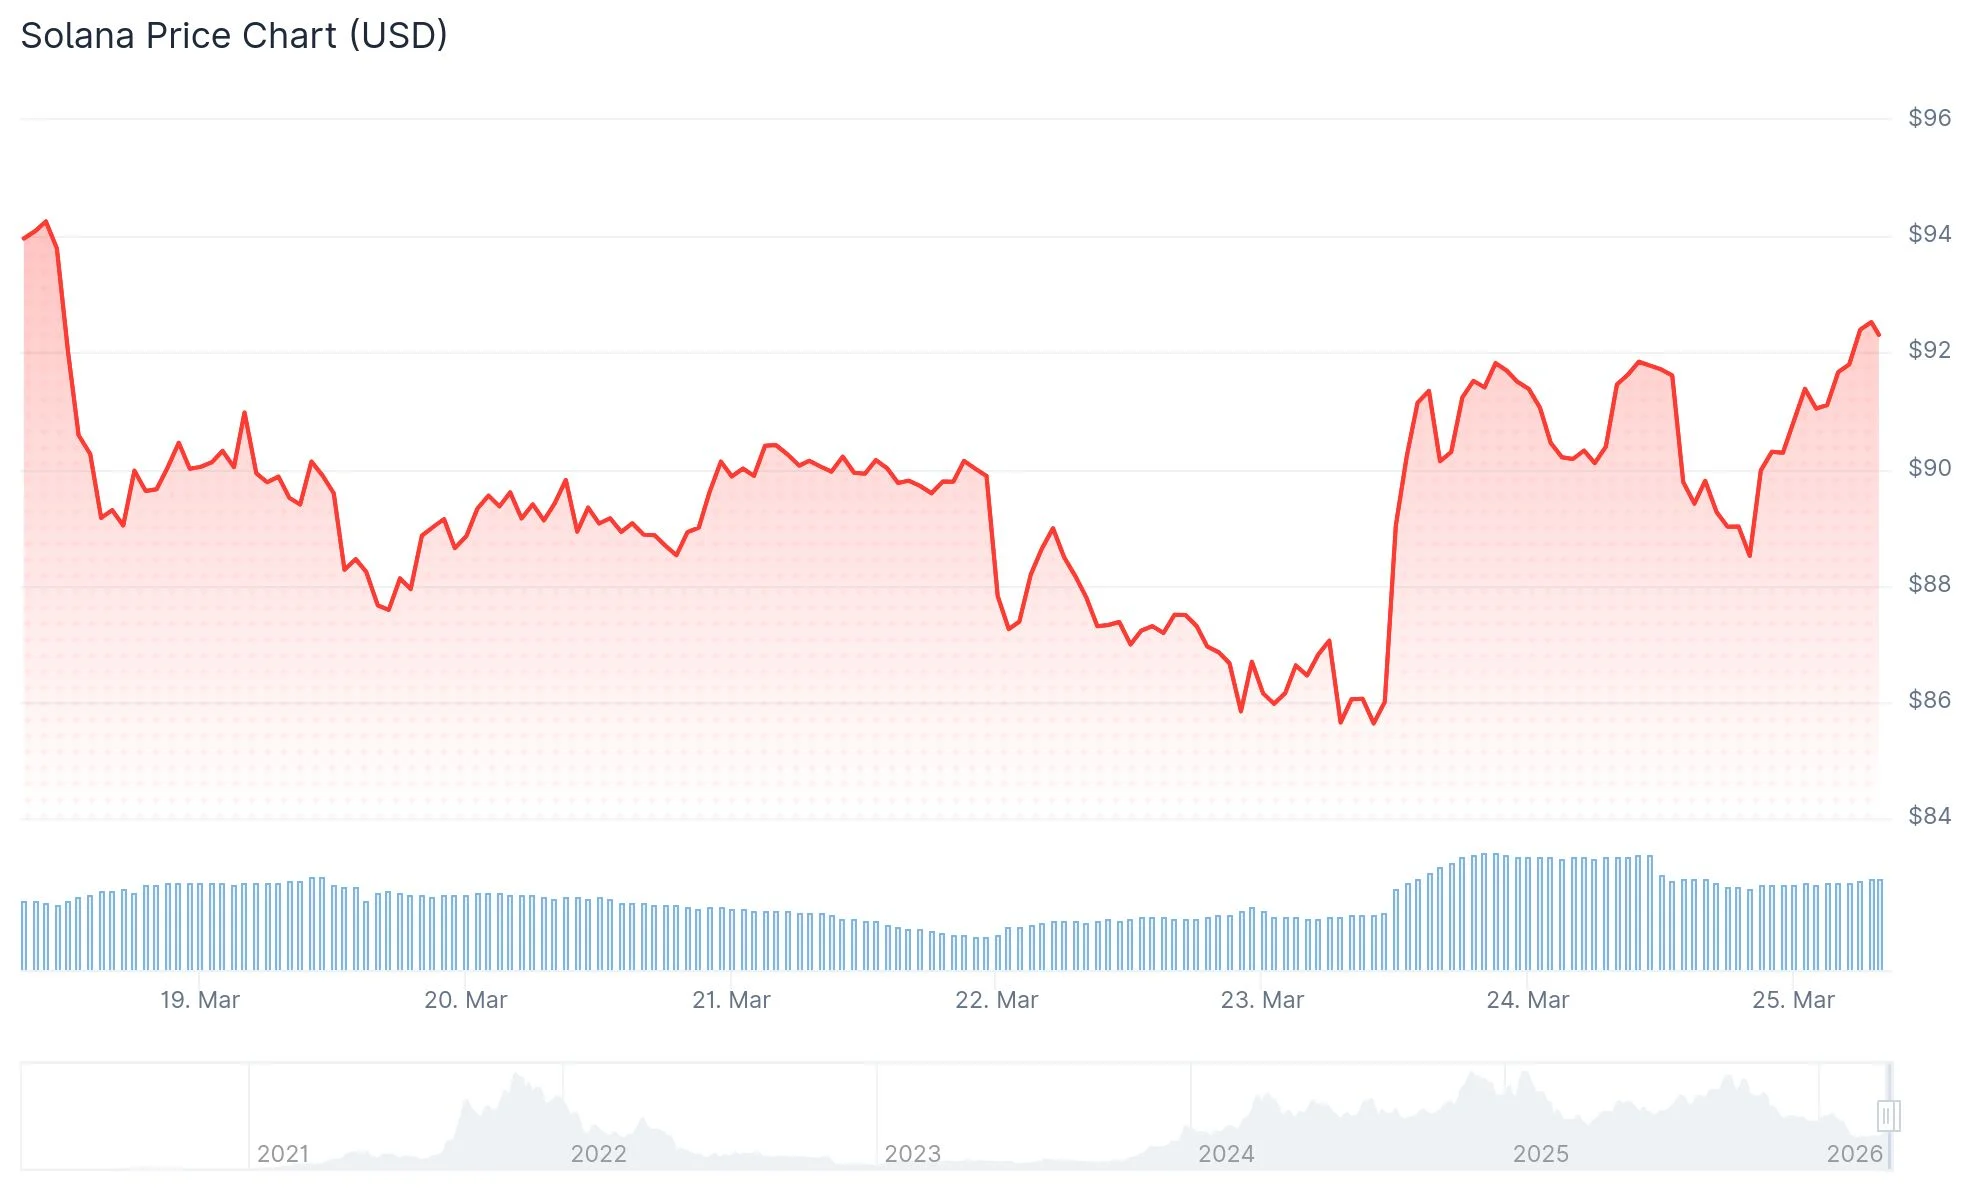
Over the last 30 days, SOL has gained approximately 7%, currently consolidating just beneath the $90 resistance barrier. Monthly volume activity expanded by 30% throughout this timeframe, approaching the $5 billion threshold—roughly equivalent to 10% of the token’s circulating supply valuation.
Cryptocurrency markets received a boost this week following President Donald Trump’s announcement to temporarily halt U.S. military operations targeting Iranian energy infrastructure. This development momentarily lifted SOL past the $90 mark, though sustained selling interest prevented the price from maintaining elevation above this level.
Liquidation records indicate that more than $370 million in bearish positions were eliminated during that upward spike. Should buying momentum persist, a more significant short squeeze scenario could materialize.
Daily chart technical indicators show the Relative Strength Index (RSI) positioned at 54, following a brief excursion above 60 in the previous week. This pattern indicates developing bullish momentum that has yet to achieve a definitive breakout.
Critical Price Thresholds Under Surveillance
Should SOL definitively breach the $90 barrier, the immediate objective becomes $100, marking an 11% advance. Continued strength beyond that milestone could drive the asset toward $120, delivering a 30% return from present valuations.
Give us something like this please. pic.twitter.com/2KXIwx0Xza
— Crypto Tony (@CryptoTony__) March 23, 2026
Analysis of the 4-hour timeframe reveals a purchase signal emerged precisely as SOL tested $90, indicating institutional accumulation at this price level. Market observers interpret this as validation that $90 carries substantial technical significance.
Conversely, should bearish forces intensify, SOL risks declining toward $85 or potentially $80. The magnitude of any downward movement would depend on the intensity of selling pressure.
Blockchain Metrics and Extended Timeframe Analysis
Blockchain analytics from Artemis reveal that Solana processed 774 million transactions during the previous week. This figure represents a 20% contraction from the most recent peak, signaling diminished network utilization.
The Fear and Greed Index has rebounded from an extreme reading of 5 to 46, demonstrating that market participants are transitioning away from panic, although overall sentiment remains measured.
Examining the monthly timeframe, cryptocurrency analyst Crypto Patel has identified a significant technical formation. He observes that each substantial SOL rally has been preceded by a monthly bullish engulfing candlestick pattern.
$SOL Has A Hidden Pattern Most Traders Miss
Every Major #Solana Rally Started With One Signal… A Monthly Bullish Engulfing Candle.
1⃣ 2020: $1.03 → $260 (252x)
3⃣ 2022: $8 → $296 (37x)
3⃣ 2026: Not Yet. But Watch Closely.No Engulfing = No Rally. Every Time.
When It… pic.twitter.com/x18WGwONNG— Crypto Patel (@CryptoPatel) March 24, 2026
Historical precedents include Solana advancing from $1.03 to $260 throughout 2020 and climbing from $8 to $296 during 2022. According to Patel’s analysis, a comparable formation in 2026 could potentially propel SOL toward $1,000 or beyond.
Present technical readings present a mixed picture. The monthly RSI registers at 35.44, with SOL trading beneath all significant moving averages, encompassing levels at $104, $111, $152, and $160.
The MACD indicator sits at -1.26, positioned below the signal line at -20.88, accompanied by a negative histogram reading, implying ongoing near-term downward pressure.
As of current market data, SOL trades at $89.33, supported by a 24-hour trading volume of $6.95 billion and maintaining a market capitalization of $51.64 billion.