
 Price Analysis: Will SOL Surge to $90 or Face Another Decline?")
Quick Overview
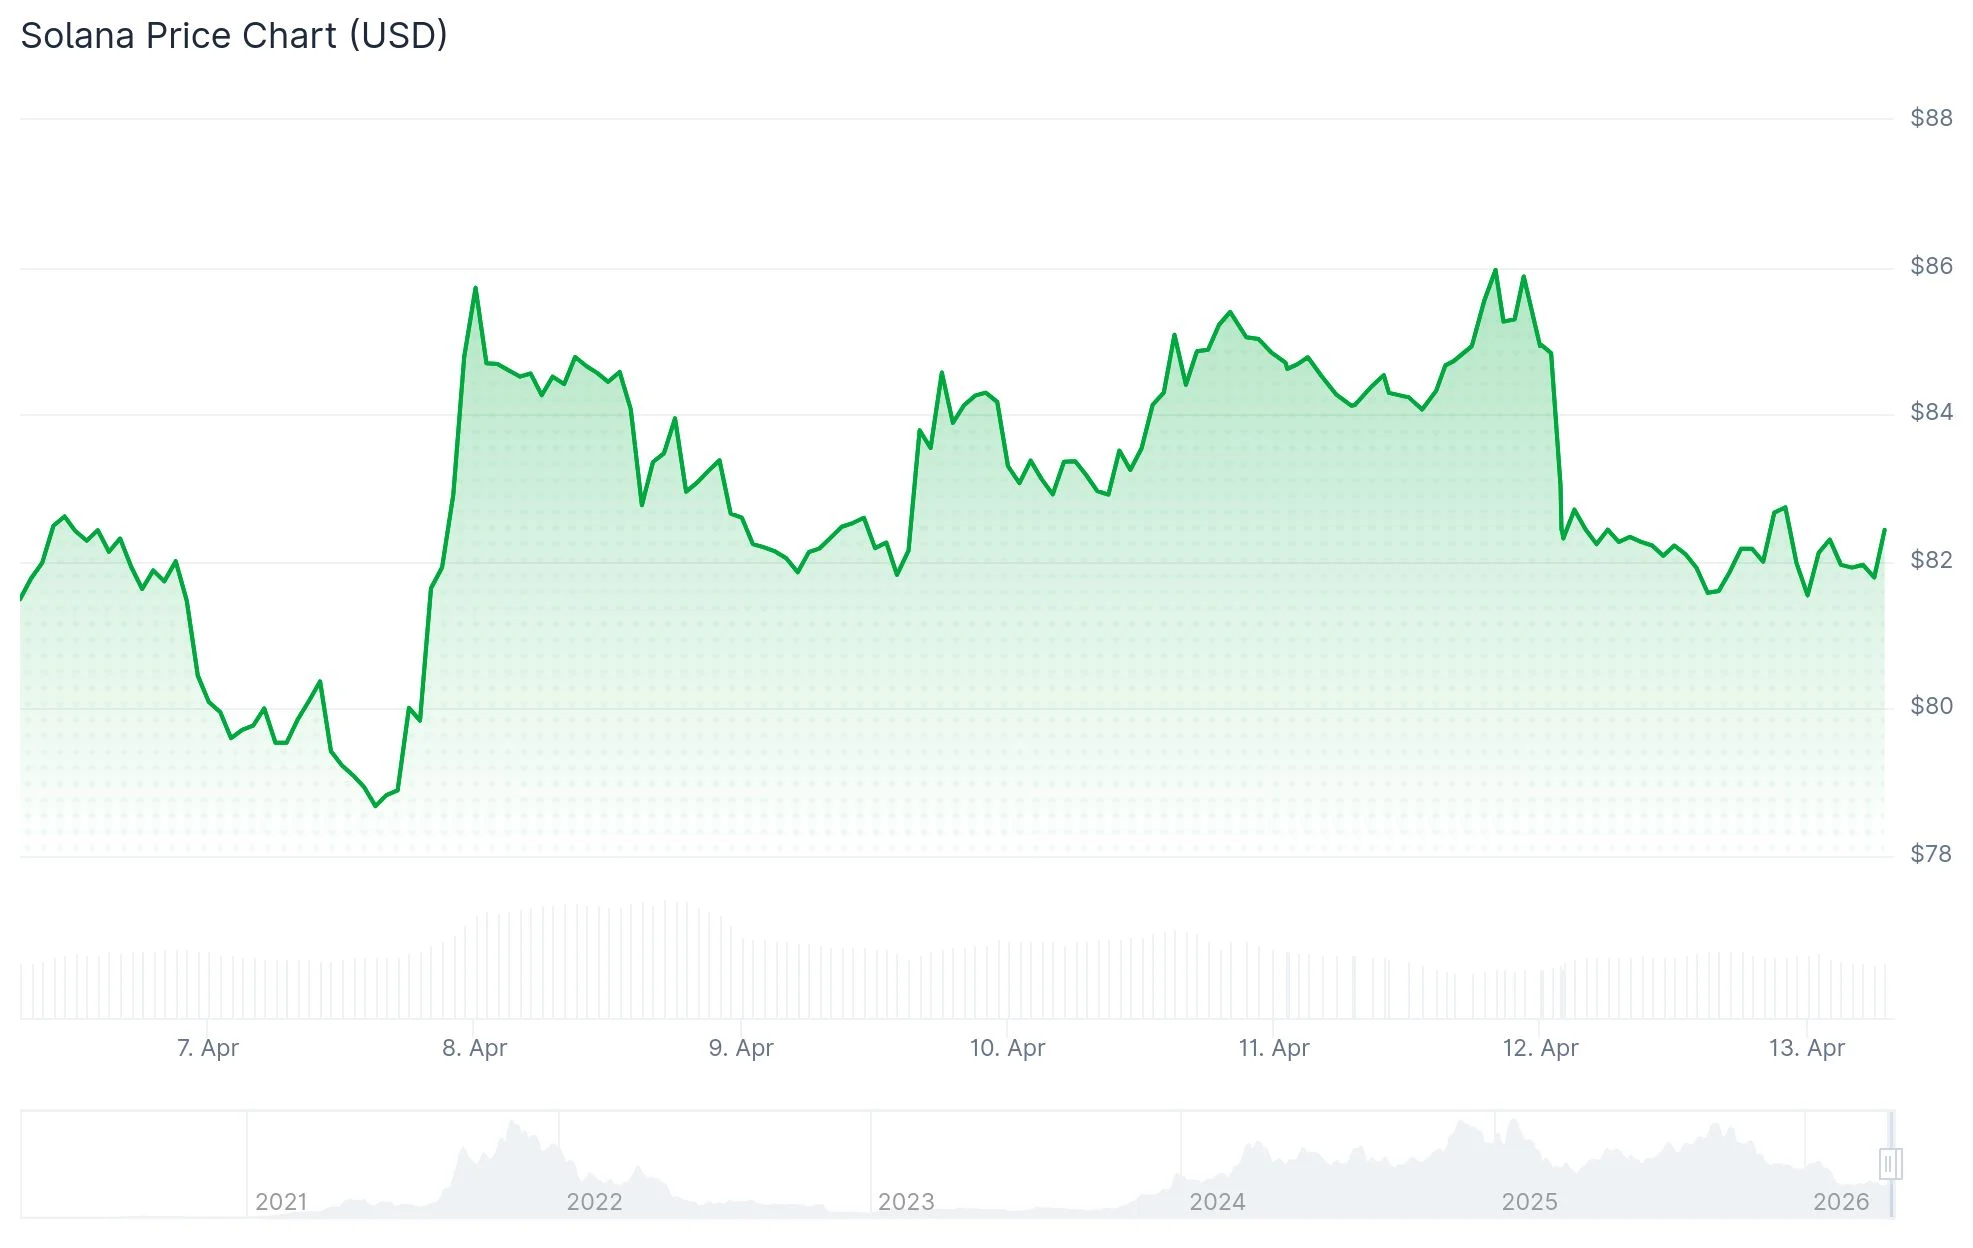
- SOL currently hovering around $80 facing resistance near $87
- Technical analysis points to $88–$90 as next Fibonacci-based targets
- Weekly timeframe analysis maintains potential $1,000 bullish scenario
- Solana ETFs experienced outflows exceeding $17 million during the past week
- Derivatives open interest dropped to $4.72 billion, indicating decreased market participation
Solana maintains its position around the $80 mark as the week begins, after experiencing a 4% decline on Sunday. This downward movement coincided with a wider cryptocurrency market correction. Trading activity has remained within a defined range, with buyers finding it difficult to overcome a critical resistance barrier.
The 50-day exponential moving average currently stands at $87.43, positioned directly beneath a falling trendline. This technical level has consistently prevented upward price advancement. The 100-day EMA rests at $99.19 while the 200-day EMA sits at $118.32, creating additional resistance barriers overhead.
According to short-term technical analysis by MCO Global, a methodical recovery pattern is emerging toward a Fibonacci-derived target area between $88.13 and $90.01. Multiple projected wave trajectories converge on this identical range, establishing it as the next logical milestone if the current recovery maintains momentum.
Critical support levels are positioned between $71.92 and $77.92. The February 5 low at $77.60 represents the immediate support floor. A breach beneath that threshold could potentially trigger a move toward $67.50.
Institutional Money Flows Turn Negative
Solana-dedicated exchange-traded funds registered more than $17 million in outflows throughout the week. A substantial withdrawal early in the period accounted for the majority of this amount. Friday brought $11.45 million in fresh inflows, reducing the weekly net outflow figure to $5.62 million.

This represents the third consecutive week of negative net flows from Solana ETF products. The trend indicates diminishing institutional interest in SOL exposure at present price levels.
Derivatives open interest declined to $4.72 billion on Monday, falling from $4.88 billion recorded the previous day. Funding rates continue to register slightly positive, suggesting long positions maintain a marginal advantage over short positions.
The Relative Strength Index remains positioned below 50, indicating subdued buying pressure. The MACD indicator trades below the zero line though displaying preliminary indications of weakening bearish momentum. A definitive reversal pattern has not yet materialized.
Weekly Timeframe Supports Long-Range Bullish Case
Market analyst James Easton highlights the weekly chart perspective and maintains the overarching technical structure remains valid. From his perspective, Solana continues trading within an expansive ascending channel without breaking down from the larger formation.
If it's not going to zero, it's going to $1,000.
And it's not going to zero. pic.twitter.com/oXEXFsyTZI
— James (@JamesEastonUK) April 11, 2026
He identifies the extreme long-range bullish objective at $1,000, contingent upon SOL avoiding a more severe breakdown and ultimately recapturing upward momentum. The present weakness, according to this interpretation, appears more characteristic of consolidation rather than structural failure.
The weekly MACD remains subdued, with momentum indicators not yet displaying upward rotation. This suggests the long-duration bullish scenario stays viable but requires sustained patience.
Solana’s latest market data confirms price stability just above $80, with the $87–$90 territory emerging as the next significant zone under market observation.