
 Rebounds From $80 Floor — But Analysts Warn of Deeper Decline Ahead")
Key Takeaways
- SOL recovered 3% over 24 hours following contact with $80 support
- Daily trading volumes jumped nearly 90%, hitting $3.7 billion
- Cryptocurrency ETFs recorded $414 million in withdrawals, marking the first negative week in over a month
- Critical resistance zone lies between $84–$85; losing $78 support may trigger a slide to $67
- Market observers identify $70–$80 as a potential long-term accumulation range
Solana is currently changing hands near $82 following a rebound from the $80 threshold. While the token posted a 3% increase over the last day, ending a four-session decline, market analysts remain hesitant to declare a full-scale turnaround.
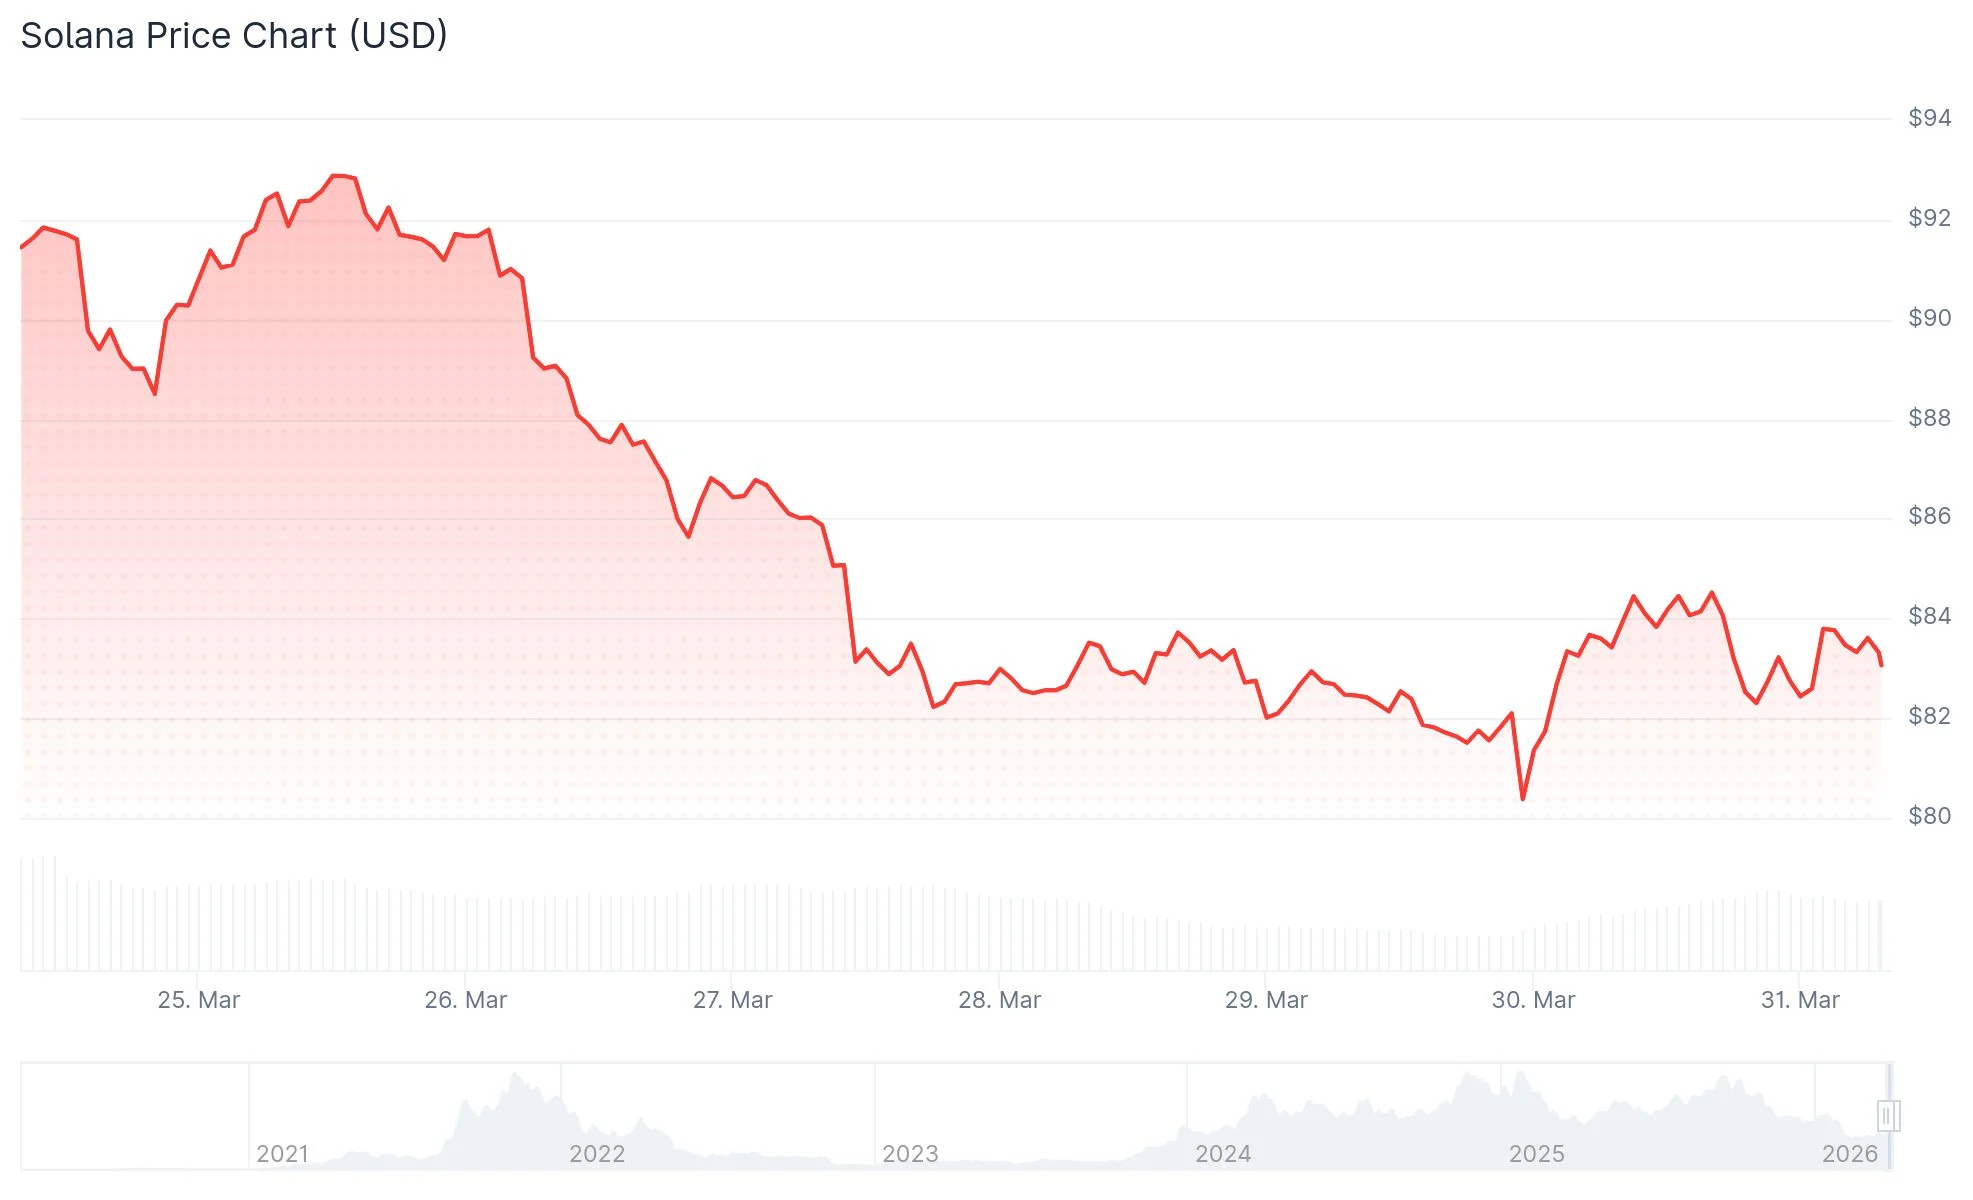
Daily trading activity surged by approximately 90% during this timeframe, climbing to $3.7 billion. This figure represents roughly 8% of SOL’s entire circulating supply valuation.
The rebound at the $80 mark appears to be a technical response to a psychological price floor. While institutional purchase orders may have accumulated at this threshold, this movement alone doesn’t necessarily indicate a reversal in the prevailing trend.
To establish a genuine recovery pattern, SOL must push back above the $90 benchmark. Such a move would signal an escape from the current trading range.
The Relative Strength Index has declined beneath 40 and fallen below its 14-day moving average. This configuration suggests increasing downside pressure in the near term.
Critical Price Levels Under Market Scrutiny
The $84–$85 region represents the initial barrier SOL must overcome. This zone functioned as a floor before the recent breakdown, making its recapture a constructive development.
Should buyers maintain control above this threshold, technical observers anticipate potential advancement toward $88, followed by $92. Conversely, failure to sustain the $82 level could prompt another test of the $78 demand area.
A breakdown beneath $78 represents the primary downside threat. Market technicians note that such a development could push Solana toward $67, matching the February 6 bottom — representing approximately a 20% decline from present levels.
This scenario continues to play out for Solana $SOL, with $74.11 and $50.18 in focus. https://t.co/susmj05GT7 pic.twitter.com/R9W73NmKHs
— Ali Charts (@alicharts) March 30, 2026
Technical analyst Ali Charts highlighted on X that downside objectives of $74.11 and $50.18 remain relevant for SOL should the current bearish pattern persist.
Broader Market Headwinds Intensify Pressure
Digital asset ETFs experienced $414 million in net withdrawals during the previous week, breaking a four-week run of positive flows. CoinShares researcher James Butterfill attributed this shift to mounting investor anxiety surrounding the Iran situation and escalating inflation projections.

Crude oil valuations have rebounded above $100 following a temporary drop below $90. The Strait of Hormuz continues to face disruptions, maintaining upward pressure on energy markets.
Elevated energy prices amplify inflation concerns, potentially compelling the Federal Reserve to maintain elevated interest rates for an extended period. Such conditions typically create headwinds for speculative assets including cryptocurrencies.
The Crypto Fear and Greed Index retreated from 46 (Neutral) to 27 (Fear), mirroring the prevailing cautious sentiment across digital asset markets.
Solana Treasury companies continue to dump towards new lows.
No buying demand is coming for $SOL, and this is really bad.
It seems like $50 SOL will happen in 2026. pic.twitter.com/6XFcs8SxcL
— Ted (@TedPillows) March 29, 2026
Market commentator Ted Pillows noted on X that companies holding Solana treasury positions continue distributing their holdings, with minimal purchasing activity evident. He projected that SOL could reach $50 during 2026.
At the time of publication, SOL is valued at $82.30, still down approximately 10% for the week.