

Key Takeaways
- A nine-year ascending triangle pattern on XRP’s monthly timeframe suggests a potential move to $8.50
- Critical support level identified between $0.75 and $0.80 for potential accumulation
- Binance’s Taker Buy/Sell ratio reached unprecedented levels, indicating increased buying activity
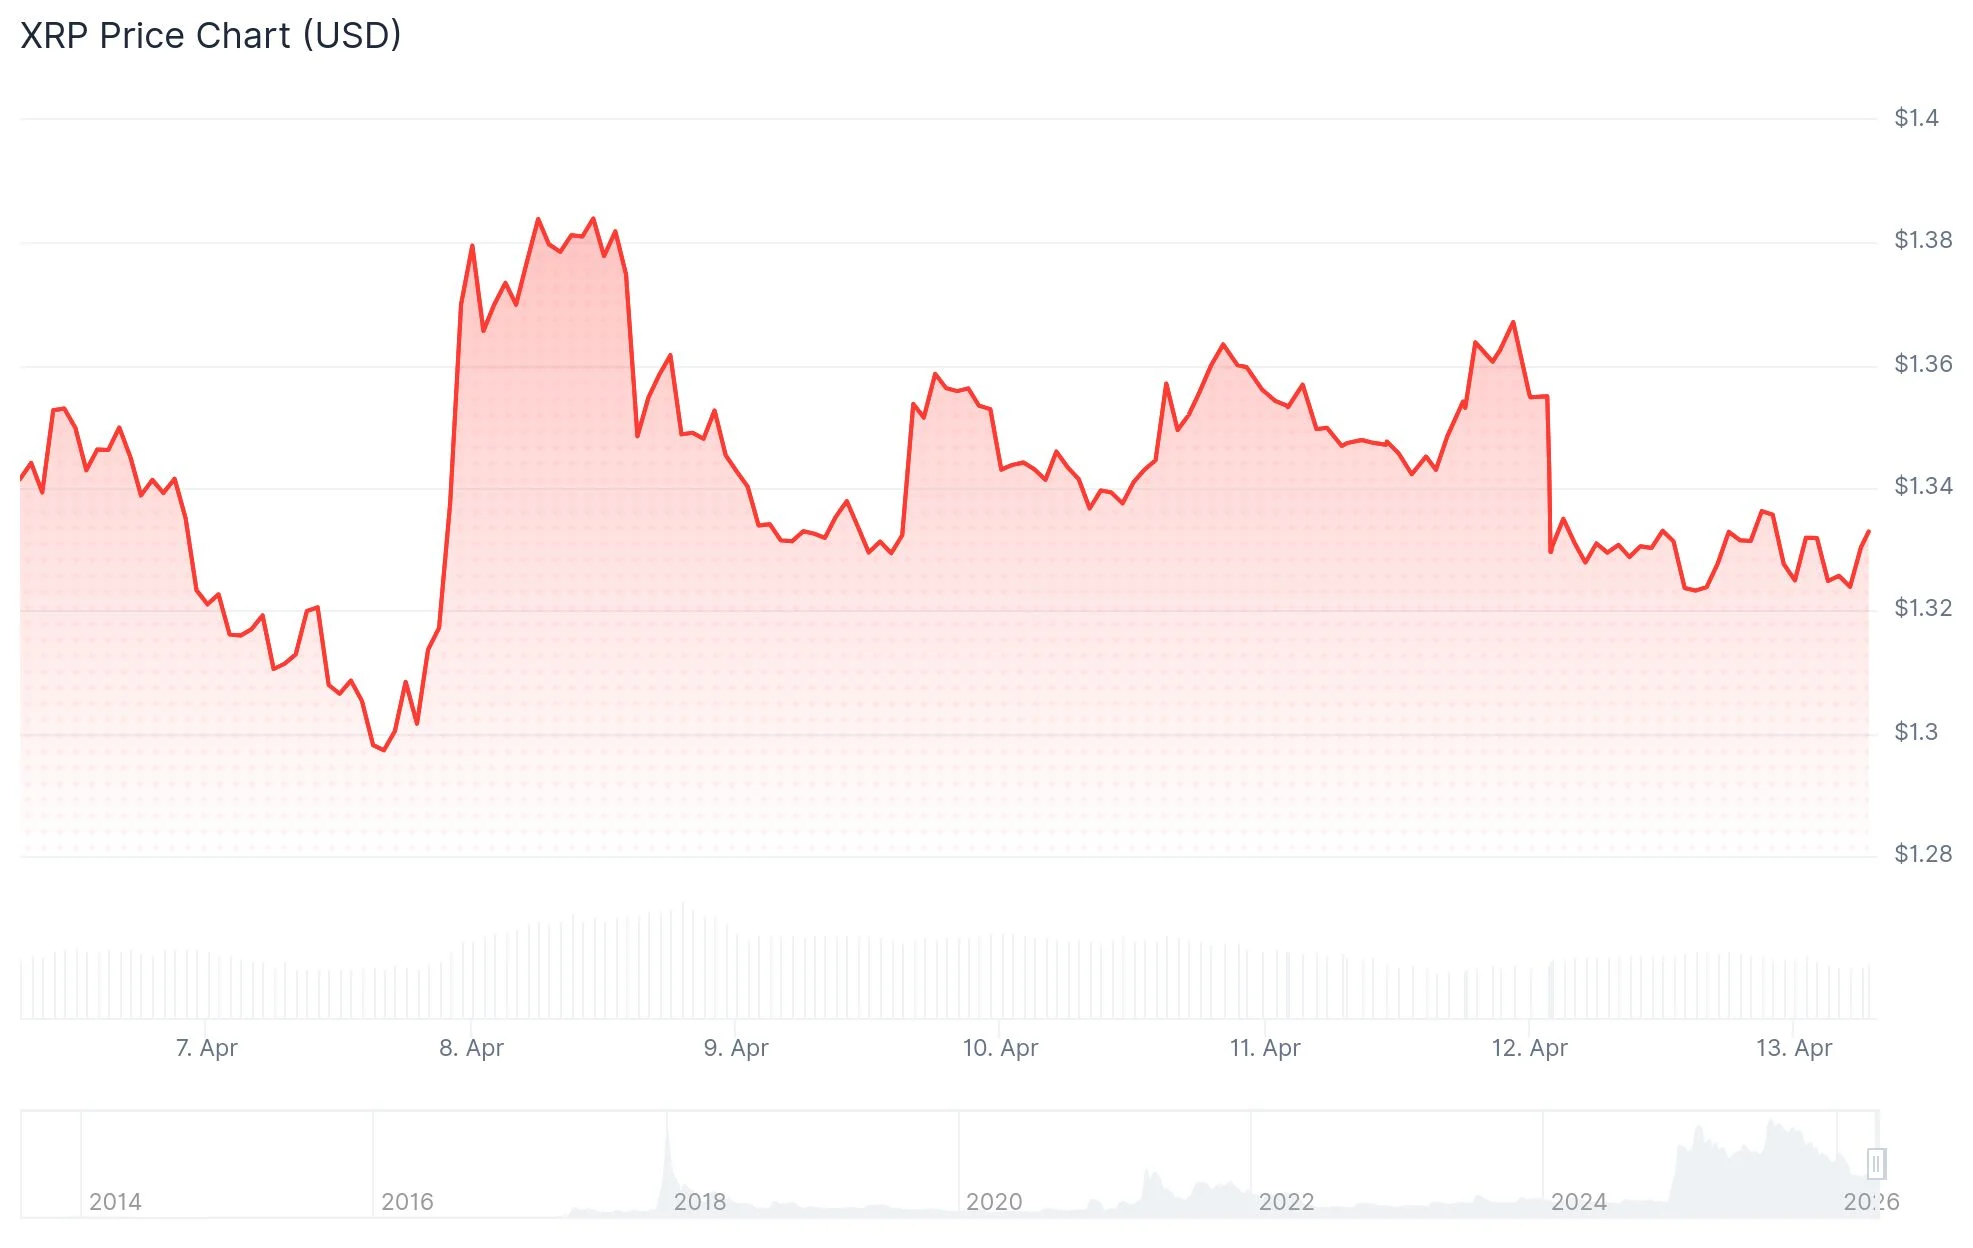
- XRP currently trades near $1.33, experiencing a 1.7% decline over 24 hours but posting a 2.36% weekly gain
- Futures open interest decreased 1.76% to $2.43 billion, while liquidations totaled $3.98M—predominantly long positions
XRP maintains its position around $1.33 while market participants monitor a technical formation that has been developing since 2017. The digital asset remains confined within a tight trading band, awaiting a decisive directional breakthrough.
Market analyst Ali Martinez shared insights on X highlighting that XRP has been constructing a substantial ascending triangle structure over the past nine years. Throughout this extended period, the asset has consistently encountered resistance at the pattern’s upper boundary, resulting in pullbacks toward an upward-sloping support trendline. This behavior has manifested repeatedly across multiple market cycles.
The next $XRP bull market will be huge!
XRP is currently trading inside a giant 9-year ascending triangle on the monthly chart. Since 2017, the script has remained the same: XRP hits the upper resistance (X-axis), gets rejected, and retraces to find its floor at the rising… pic.twitter.com/bMJ7q582Id
— Ali Charts (@alicharts) April 12, 2026
Martinez’s technical analysis reveals horizontal resistance positioned around $3.30, a level that has historically capped upward momentum. Meanwhile, the ascending support trendline has maintained its upward trajectory, bringing both boundaries closer to convergence—a critical juncture where breakouts traditionally materialize.
Should the breakout scenario unfold, Martinez projects a price objective of $8.50. This ambitious target represents an approximate 530% appreciation from present valuation levels.
Critical Support Zone Identified Between $0.75 and $0.80
The latest rejection from resistance materialized in August 2025. Following this price action, Martinez highlighted the $0.75–$0.80 zone as a crucial level for market participants to monitor. He characterized this area as an “ultimate buy the dip opportunity” prior to the triangle pattern reaching its convergence point.
Separately, analyst Crypto TXG observed that XRP remains confined within a shorter-duration consolidation zone spanning $1.61 to $1.82. Significant directional momentum has yet to emerge, and a clear breakout from this range remains necessary for establishing the next intermediate-term trajectory.
Blockchain Metrics Indicate Accumulation Behavior
Analyst CryptoOnchain highlighted notable developments in Binance’s Taker Buy/Sell ratio. The 100-day moving average recently achieved an all-time high. Concurrently, the 30-day metric registered 0.495 for buyers, while the corresponding sell ratio declined to 0.505.
This dynamic suggests an increasing number of market participants are executing aggressive buy orders, while selling pressure diminishes. The data indicates systematic accumulation occurring beneath surface-level price action.
United States-based spot XRP exchange-traded funds recorded $11.5 million in net inflows throughout the previous week, despite certain trading days showing zero activity.
🧐 Looking for an encouraging low-risk entry point for XRP? According to our weekly social data for crypto's #4 market cap, FUD is at its 3rd highest point in the past 2 years.
📉 Historically, when bullish comments get replaced by this level of bearish ones, the probability of… pic.twitter.com/JfAa2btWed
— Santiment (@santimentfeed) April 13, 2026
Santiment reported that negative social media sentiment surrounding XRP has reached its third-highest concentration in two years. The analytics platform emphasized that historically, extreme bearish sentiment levels have frequently preceded contrary price movements.
Futures open interest contracted 1.76% to $2.43 billion. Liquidation statistics revealed $3.98 million eliminated within a 24-hour window, with $3.35 million originating from long positions—evidence of persistent near-term pressure affecting bullish speculators.