

Key Takeaways
- Ripple’s XRP has recorded six consecutive months of losses, marking its longest decline period since 2014, with prices plummeting over 60% from the $3.65 peak.
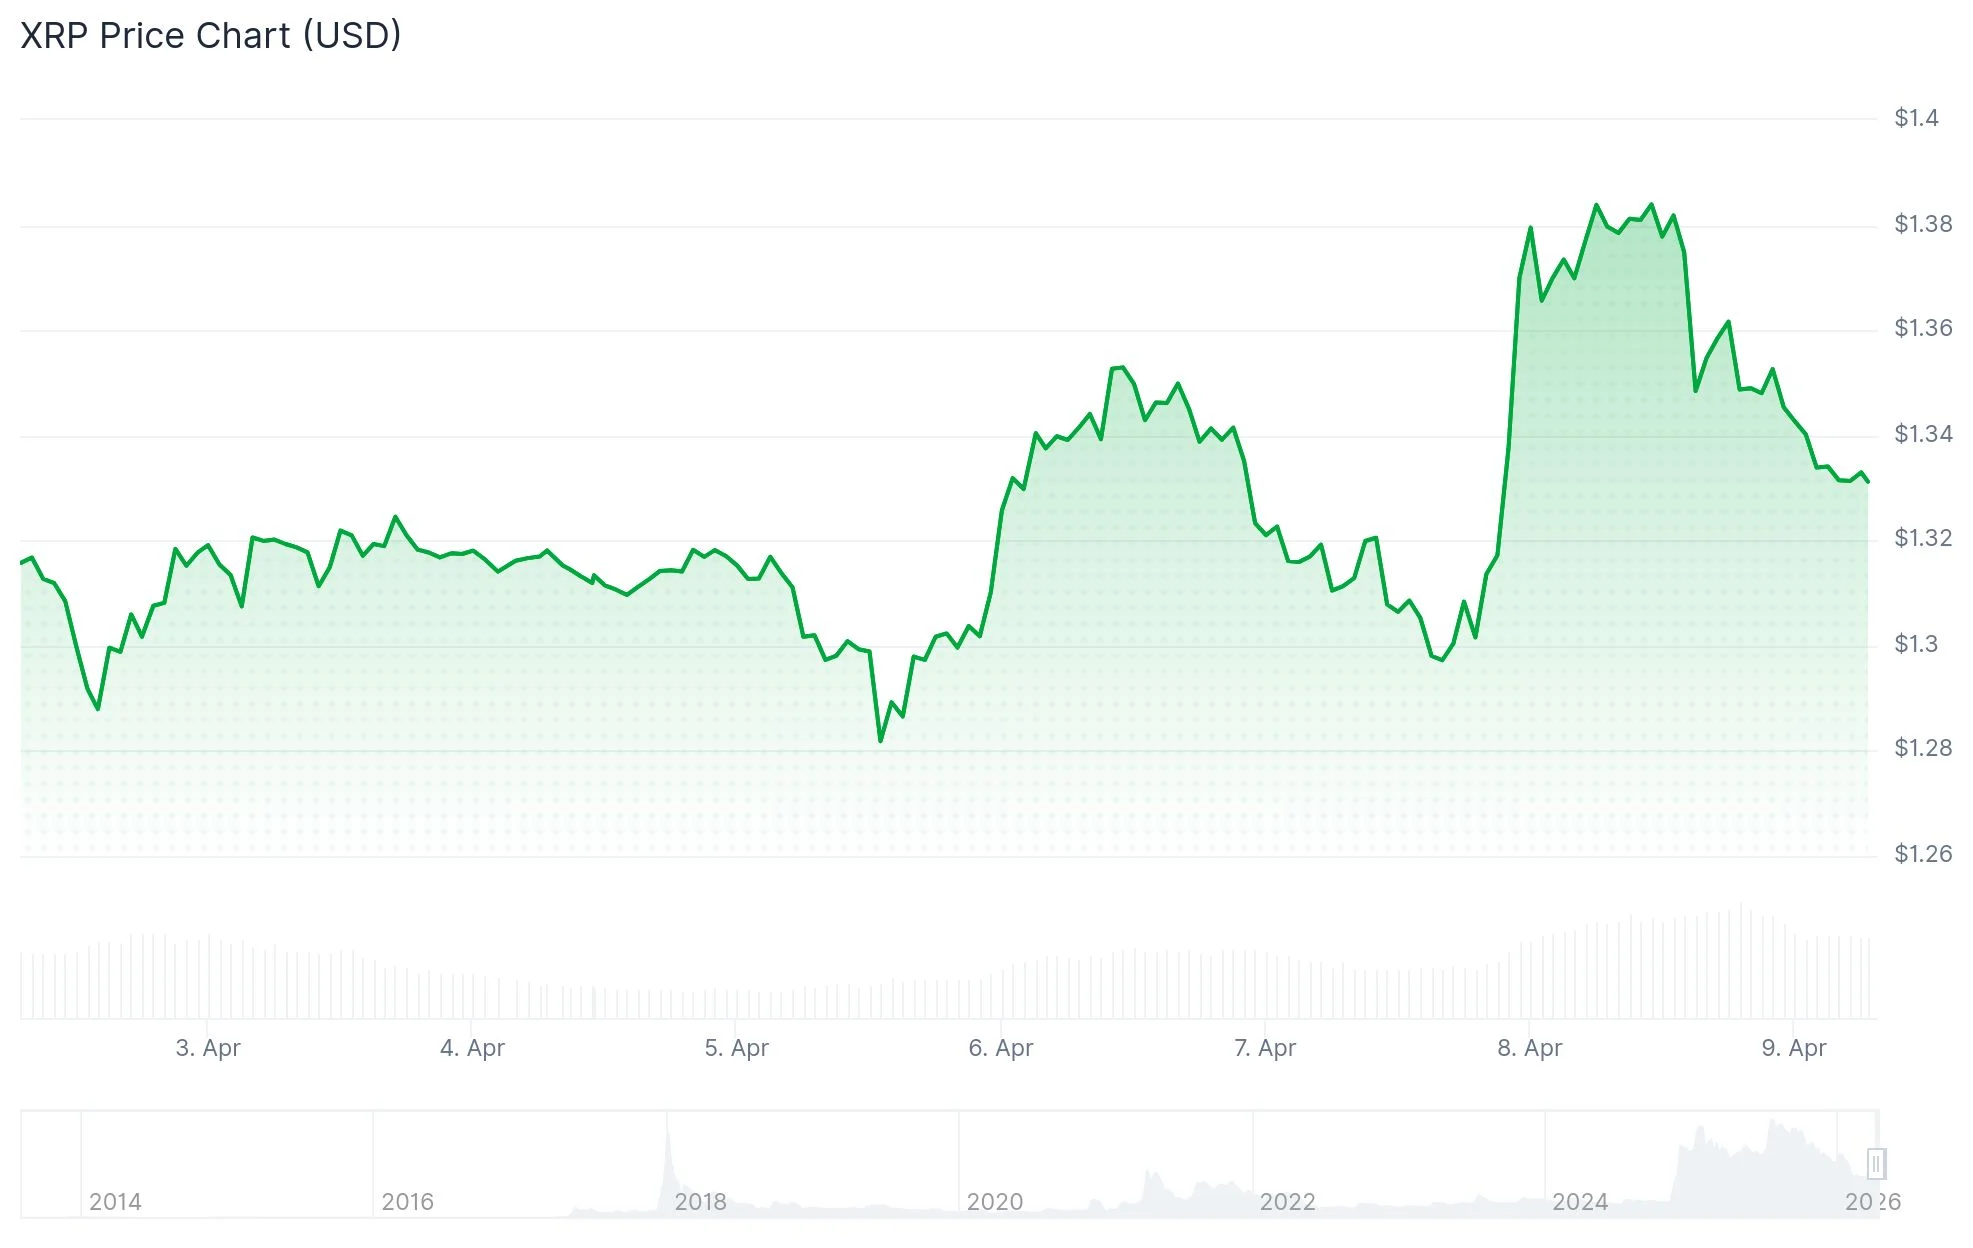
- Price action shows continued weakness between $1.33 and $1.37, with resistance levels consistently triggering sell-offs from profit-taking traders.
- Exchange-traded fund products linked to Ripple recorded $3.32 million in capital inflows, reversing March’s outflow trend, though insufficient to halt the decline.
- Large-holder wallets have been accumulating more than 11 million XRP tokens daily based on 30-day averages, per CryptoQuant analytics dated April 6.
- Breaking above $1.33 by month’s end would halt the losing streak, with the proposed CLARITY Act and Bitcoin’s strength providing possible upward momentum.
Ripple’s XRP token has experienced an unprecedented six consecutive months of price declines, representing the longest sustained downturn since 2014. The digital asset has shed more than 60% of its value from the $3.65 cycle peak established last July. Even as brief rallies pushed toward $1.40, persistent selling pressure has maintained downward momentum.
The downward trajectory commenced in October 2025 following President Trump’s announcement of comprehensive 100% tariffs on Chinese imports, which sparked the cryptocurrency market’s most severe single-day liquidation event on record. The cascade eliminated over $19 billion in leveraged trading positions within a 24-hour window. XRP tumbled from above $2.80 to sub-$2.00 levels in the immediate aftermath.
Subsequent recovery efforts throughout November and December encountered headwinds from sustained ETF capital outflows and deteriorating institutional sentiment. The situation intensified in late February 2026 when Iran-related tensions escalated dramatically, sending crude oil prices above $100 per barrel following the strategic closure of the Strait of Hormuz shipping corridor.
The Federal Reserve’s response included raising inflation projections, triggering institutional capital rotation away from riskier asset classes. Positive XRP developments throughout 2026—including commodity status classification, growing ETF participation, and strategic Ripple partnership announcements—proved insufficient against prevailing macroeconomic headwinds.
Distribution from existing XRP holders compounded the decline. Approximately 60% of circulating XRP supply remains underwater on cost basis. Each price recovery toward the $1.44 average acquisition cost triggered waves of breakeven selling from holders seeking exits. This cyclical pattern dominated price action throughout the November-to-March period.
Persistent Selling Dominates Critical Price Levels
Hourly timeframe analysis reveals XRP’s descent from $1.37 to $1.33, with accelerated downside momentum following rejection at the $1.38 threshold. Elevated transaction volumes accompanied the decline, confirming distribution activity. Late-session price discovery tested $1.31 support before modest stabilization emerged, though recovery attempts remained unconvincing.
$XRP Bull Market Scenario pic.twitter.com/KJj0u5yIm6
— CW (@CW8900) April 8, 2026
A descending resistance trendline has established itself with overhead pressure at $1.3550. Current trading occurs beneath the 100-period Simple Moving Average on hourly charts. The combination of rising volume during price declines suggests ongoing distribution rather than strategic accumulation patterns.
Ripple-associated exchange-traded products attracted $3.32 million in net inflows, representing a directional shift from the previous month’s outflows. However, diminishing exchange liquidity levels increase vulnerability to amplified price swings should critical support zones fail. Immediate support rests at $1.33, with the more significant defense level positioned at $1.28.
ETF FLOWS: US SPOT CRYPTO ETFs FLOWS DATA UPDATE (07-04-2026):
🟥 Bitcoin ETFs: -2,318 $BTC (-$159.05M)
🟥 Ethereum ETFs: -30,850 $ETH (-$64.67M)
🟥 SOLANA ETFs: -190.56K $SOL (-$15.40M)
🟩 XRP ETFs: +2.54M $XRP (+$3.32M)
🟩 HBAR ETFs: +5.46M $HBAR (+$472.05K)
🟩 $LINK, $LTC,… https://t.co/UvnZL0A6fH pic.twitter.com/OGCtMuTHAQ— Crypto Patel (@CryptoPatel) April 8, 2026
Large Holder Accumulation Reaches Ten-Month Peak
CryptoQuant blockchain analytics from April 6 indicate whale accumulation activity has reached its highest level in ten months. High-net-worth wallets have been absorbing in excess of 11 million XRP tokens daily when measured across 30-day rolling averages. Concurrent exchange withdrawal activity has intensified, contracting available selling supply.
XRP dominated cryptocurrency ETF inflows during the previous week with $120 million in net capital allocation. Bitcoin has advanced beyond $71,000 while XRP currently maintains trading above $1.35.
XRP concluded March at the $1.33 price level. A monthly closing price exceeding this threshold would terminate the six-month losing sequence. The proposed CLARITY Act, which seeks to establish permanent federal digital commodity classification for XRP, may advance if the Senate Banking Committee concludes its legislative markup process during late April.